• Spectroscopy and Spectral Analysis
  • Vol. 41, Issue 7, 2036 (2021)
Yi-jia LUO1、*, He ZHU1、1;, Xiao-han LI1、1;, Juan DONG1、1;, Hao TIAN1、1;, Xue-wei SHI1、1;, Wen-xia WANG2、2;, and Jing-tao SUN1、1; *;
Author Affiliations
  • 11. College of Food Science, Shihezi University, Shihezi 832003, China
  • 22. College of Mechanical and Electrical Engineering, Shihezi University, Shihezi 832003, China
  • show less
    DOI: 10.3964/j.issn.1000-0593(2021)07-2036-07 Cite this Article
    Yi-jia LUO, He ZHU, Xiao-han LI, Juan DONG, Hao TIAN, Xue-wei SHI, Wen-xia WANG, Jing-tao SUN. Quantitative Analysis of Total Phenol Content in Cabernet Sauvignon Grape Based on Near-Infrared Spectroscopy[J]. Spectroscopy and Spectral Analysis, 2021, 41(7): 2036 Copy Citation Text show less
    Raw spectra of Cabernet Sauvignon in different harvest stages
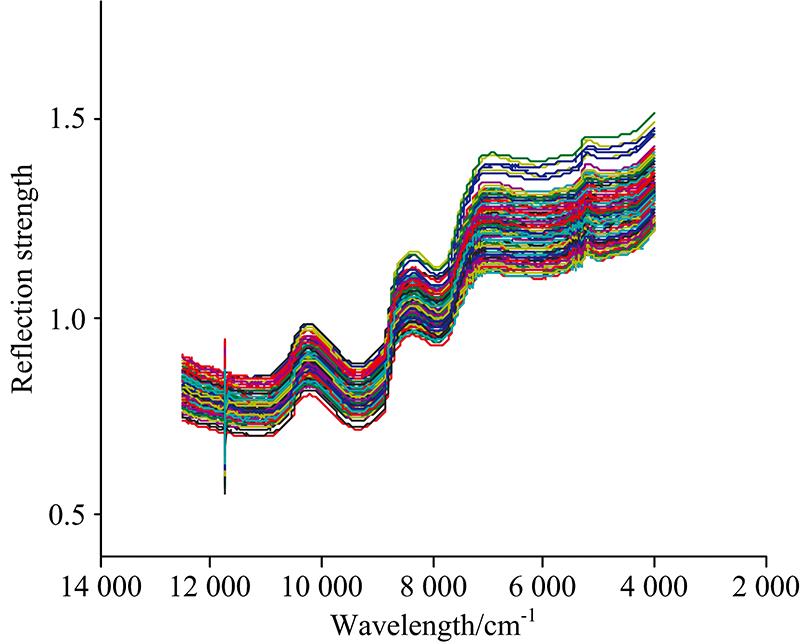
    Fig. 1. Raw spectra of Cabernet Sauvignon in different harvest stages
    Mean raw spectra of Cabernet Sauvignon in different harvest stages
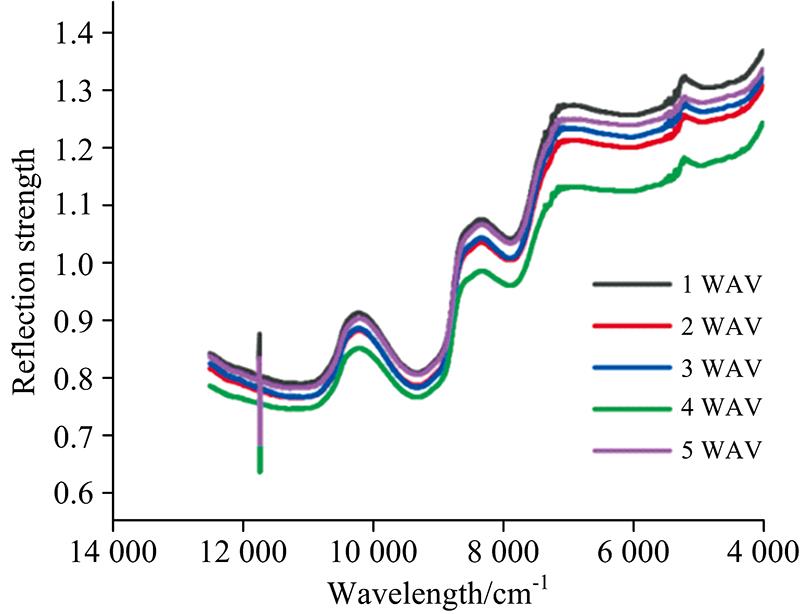
    Fig. 2. Mean raw spectra of Cabernet Sauvignon in different harvest stages
    Reflectance spectra obtained after MSC
    Fig. 3. Reflectance spectra obtained after MSC
    Characteristic wavebands selected by CARS algorithm(a): Variation of the number of selected wavelength variables; (b): Variation of RMSECV;(c): The changing trend of variable regression coefficients
    Fig. 4. Characteristic wavebands selected by CARS algorithm
    (a): Variation of the number of selected wavelength variables; (b): Variation of RMSECV;(c): The changing trend of variable regression coefficients
    (a) Frequency distribution of bands selected by GA; (b) Selection of wavelengths by the GA method
    Fig. 5. (a) Frequency distribution of bands selected by GA; (b) Selection of wavelengths by the GA method
    Characteristic wavebands selected by si-PLS method
    Fig. 6. Characteristic wavebands selected by si-PLS method
    Plot of 50 wavelengths selected by SPA
    Fig. 7. Plot of 50 wavelengths selected by SPA
    The influence of the number of neurons in different hidden layers on the performance of the model
    Fig. 8. The influence of the number of neurons in different hidden layers on the performance of the model
    Scatter plot of real value and predicted value of total phenol content
    Fig. 9. Scatter plot of real value and predicted value of total phenol content
    WAV样本数量最大值最小值平均值标准偏差
    14028.0114.6518.992.956
    24028.9617.0722.202.919
    34029.6411.2324.613.366
    44034.8519.8628.103.576
    54032.6417.1225.684.397
    Table 1. Statistical results of total phenol content of Cabernet Sauvignon in different harvest stages (mg·g-1)
    预处理方法校正集预测集RPD
    RcRMSECRpRMSEP
    原始0.645 43.615 40.595 93.487 51.245 3
    MSC0.688 03.494 10.680 92.943 11.365 5
    SNV0.725 43.313 90.654 33.039 11.322 3
    MC0.674 53.494 70.610 13.441 01.262 1
    MA0.646 43.591 30.606 93.506 81.258 2
    一阶导数+SG0.634 23.649 20.623 13.501 31.278 6
    Table 2. Results of ELM modeling for the total phenol content with different pre-treatment methods
    激活函数
    类型
    RMSECRcRMSEPRpRPD运行时
    间/s
    Sigmoid2.196 00.893 31.861 50.878 32.091 434.39
    Sine2.602 70.846 41.946 60.866 01.999 933.84
    Hardlim3.432 40.710 83.632 40.374 41.078 533.46
    Table 3. Performance comparison of different activation functions
    Prediction
    models
    Selection
    methods
    Variables
    number
    Calibration setsPrediction setsRPD
    RcRMSECRpRMSEP
    ELMCARS690.856 32.524 20.824 52.203 21.767 0
    GA1680.763 83.158 80.732 82.603 81.469 5
    Si-PLS4130.733 43.346 40.669 92.778 21.346 9
    SPA500.742 73.216 40.731 42.847 11.466 4
    GA-ELMCARS690.901 72.112 40.901 31.686 82.308 0
    GA1680.835 62.688 80.834 72.107 31.815 8
    Si-PLS4130.798 72.962 20.719 12.600 31.375 4
    SPA500.854 72.493 70.844 92.233 41.869 3
    Table 4. The prediction results of ELM and GA-ELM models
    Yi-jia LUO, He ZHU, Xiao-han LI, Juan DONG, Hao TIAN, Xue-wei SHI, Wen-xia WANG, Jing-tao SUN. Quantitative Analysis of Total Phenol Content in Cabernet Sauvignon Grape Based on Near-Infrared Spectroscopy[J]. Spectroscopy and Spectral Analysis, 2021, 41(7): 2036
    Download Citation