• Advanced Photonics Nexus
  • Vol. 2, Issue 2, 026003 (2023)
Shaun Lung1, Jihua Zhang1、*, Kai Wang2, and Andrey A. Sukhorukov1
Author Affiliations
  • 1The Australian National University, Research School of Physics, Centre of Excellence for Transformative Meta-Optical Systems (TMOS), Department of Electronic Materials Engineering, Canberra, Australian Capital Territory, Australia
  • 2McGill University, Department of Physics, Montréal, Quebec, Canada
  • show less
    DOI: 10.1117/1.APN.2.2.026003 Cite this Article Set citation alerts
    Shaun Lung, Jihua Zhang, Kai Wang, Andrey A. Sukhorukov. Real-time monitoring of polarization state deviations with dielectric metasurfaces[J]. Advanced Photonics Nexus, 2023, 2(2): 026003 Copy Citation Text show less
    Concept of polarization monitoring with a metasurface. (a) An arbitrarily chosen elliptical anchor polarization (red cross) on a Poincaré sphere and deviations |δ|2 up to 0.01 are indicated by a crown. (b) An experimental scheme utilizing a metasurface performing a special nonunitary transformation T that maps a perturbed input polarization |ψin⟩ to an output state |ψout⟩, allowing for real-time monitoring of input polarization deviations using only a polarizing beam splitter and the power measurements PV and PH. (c) At the output, the anchor state is converted to the vertical polarization, and the horizontal component represents the deviation, which is enhanced by a responsivity factor η.
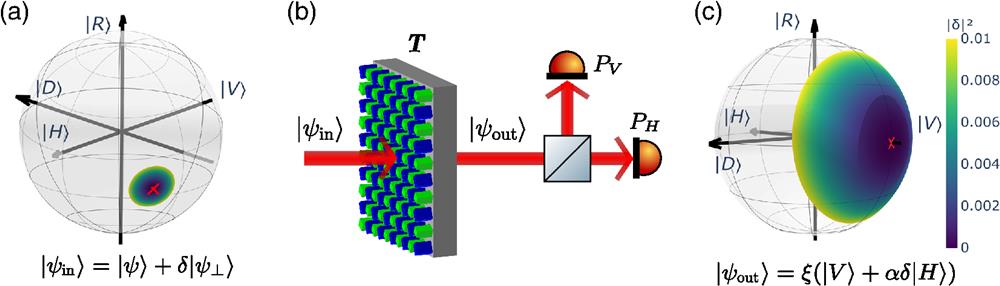
    Fig. 1. Concept of polarization monitoring with a metasurface. (a) An arbitrarily chosen elliptical anchor polarization (red cross) on a Poincaré sphere and deviations |δ|2 up to 0.01 are indicated by a crown. (b) An experimental scheme utilizing a metasurface performing a special nonunitary transformation T that maps a perturbed input polarization |ψin to an output state |ψout, allowing for real-time monitoring of input polarization deviations using only a polarizing beam splitter and the power measurements PV and PH. (c) At the output, the anchor state is converted to the vertical polarization, and the horizontal component represents the deviation, which is enhanced by a responsivity factor η.
    Schematic representation of optimal metasurface for monitoring of polarization deviations. (a) One unit cell of the silicon metasurface for achieving the nonunitary transformation T. Response of metasurface to incident (b) anchor polarization state |ψ⟩ and (c) perturbed state |ψ⊥⟩. The diffraction losses are specially designed to be stronger or weaker, as shown by thicker or thinner dashed lines, respectively.
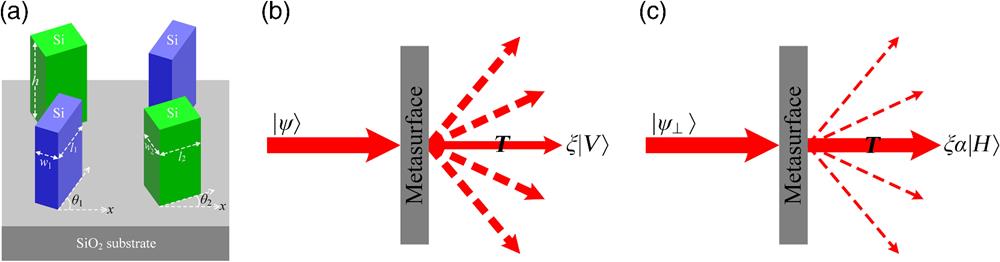
    Fig. 2. Schematic representation of optimal metasurface for monitoring of polarization deviations. (a) One unit cell of the silicon metasurface for achieving the nonunitary transformation T. Response of metasurface to incident (b) anchor polarization state |ψ and (c) perturbed state |ψ. The diffraction losses are specially designed to be stronger or weaker, as shown by thicker or thinner dashed lines, respectively.
    (a) Scanning electron microscope (SEM) image of metasurface fabricated to implement polarization sensing. The unit cell is indicated using the black, dashed box, with rotation from the horizontal indicated by θ. (b) Experimentally characterized transfer matrix of the metasurface at θ=64 deg. (c) Dependence of the anchor state on the metasurface rotation angle θ displayed on a Poincaré sphere, with |D⟩, |H⟩, and |R⟩ indicating the diagonal, horizontal, and right-circular polarization states, respectively. The anchor state relating to the transfer matrix in (b) is indicated by the red cross. (d) Predicted power ratios PH/PV against deviation from anchor state |δ|2. The phase of the deviation ϕδ, indicated by the color gradient, results in a relative uncertainty range 2|γδ| in determining |δ|. (e) Variation of responsivity as the metasurface is rotated by angle θ. The angle corresponding to (b) and (d) is indicated by the dashed line. (f) Uncertainty parameter |γexp| dependence on the rotation of the metasurface. Shown for comparison is a theoretically best value |γsym| for any nonchiral metasurface with purely symmetrical transfer matrix, considered for the same anchor state and responsivity. Shading indicates the region with |γexp|<|γsym|, where experimental results demonstrate the advantage of the chiral response. Details of these calculations can be found in Sec. S3 in the Supplementary Material.
    Fig. 3. (a) Scanning electron microscope (SEM) image of metasurface fabricated to implement polarization sensing. The unit cell is indicated using the black, dashed box, with rotation from the horizontal indicated by θ. (b) Experimentally characterized transfer matrix of the metasurface at θ=64  deg. (c) Dependence of the anchor state on the metasurface rotation angle θ displayed on a Poincaré sphere, with |D, |H, and |R indicating the diagonal, horizontal, and right-circular polarization states, respectively. The anchor state relating to the transfer matrix in (b) is indicated by the red cross. (d) Predicted power ratios PH/PV against deviation from anchor state |δ|2. The phase of the deviation ϕδ, indicated by the color gradient, results in a relative uncertainty range 2|γδ| in determining |δ|. (e) Variation of responsivity as the metasurface is rotated by angle θ. The angle corresponding to (b) and (d) is indicated by the dashed line. (f) Uncertainty parameter |γexp| dependence on the rotation of the metasurface. Shown for comparison is a theoretically best value |γsym| for any nonchiral metasurface with purely symmetrical transfer matrix, considered for the same anchor state and responsivity. Shading indicates the region with |γexp|<|γsym|, where experimental results demonstrate the advantage of the chiral response. Details of these calculations can be found in Sec. S3 in the Supplementary Material.
    Experimental measurement of power ratios for an elliptical anchor state of [cos(0.362π),sin(0.362π)exp(−0.390πi)]T, for the metasurface rotated at an angle θ=64 deg and operating wavelength of 1573.8 nm. (a) The polarization ellipse of the input polarization states used for the measurement. The precise anchor state is indicated by the black line, with variations from this state indicated by the blue, shaded region. (b) Measured output power ratios (PH/PV) plotted on a Poincaré sphere with positions corresponding to the corresponding input polarization states. The color shading indicates the variation of power ratio as the state deviates from the anchor state (cyan marker). (c) The experimental power ratios plotted versus the deviations from the anchor states.
    Fig. 4. Experimental measurement of power ratios for an elliptical anchor state of [cos(0.362π),sin(0.362π)exp(0.390πi)]T, for the metasurface rotated at an angle θ=64  deg and operating wavelength of 1573.8 nm. (a) The polarization ellipse of the input polarization states used for the measurement. The precise anchor state is indicated by the black line, with variations from this state indicated by the blue, shaded region. (b) Measured output power ratios (PH/PV) plotted on a Poincaré sphere with positions corresponding to the corresponding input polarization states. The color shading indicates the variation of power ratio as the state deviates from the anchor state (cyan marker). (c) The experimental power ratios plotted versus the deviations from the anchor states.
    Experimental results for a near-circular anchor state of [cos(0.21π),sin(0.21π)exp(−0.448πi)]T, for the metasurface rotated at an angle θ=−58 deg and operating wavelength of 1550.5 nm. Plots (a)–(c) follow the same conventions as in Fig. 4.
    Fig. 5. Experimental results for a near-circular anchor state of [cos(0.21π),sin(0.21π)exp(0.448πi)]T, for the metasurface rotated at an angle θ=58  deg and operating wavelength of 1550.5 nm. Plots (a)–(c) follow the same conventions as in Fig. 4.
    Shaun Lung, Jihua Zhang, Kai Wang, Andrey A. Sukhorukov. Real-time monitoring of polarization state deviations with dielectric metasurfaces[J]. Advanced Photonics Nexus, 2023, 2(2): 026003
    Download Citation