• Laser & Optoelectronics Progress
  • Vol. 60, Issue 1, 0130001 (2023)
Jin Li1, Hong Jiang1、*, Mu Si1, and Minfan Chen2
Author Affiliations
  • 1College of Investigation, People's Public Security University of China, Beijing 100038, China
  • 2JINSP Co., Ltd., Beijing 100084, China
  • show less
    DOI: 10.3788/LOP212662 Cite this Article Set citation alerts
    Jin Li, Hong Jiang, Mu Si, Minfan Chen. Study on the Classification of Lipsticks Using Raman Spectroscopy and X-Ray Fluorescence[J]. Laser & Optoelectronics Progress, 2023, 60(1): 0130001 Copy Citation Text show less
    Raman spectrum of sample No.5 of class Ⅰ
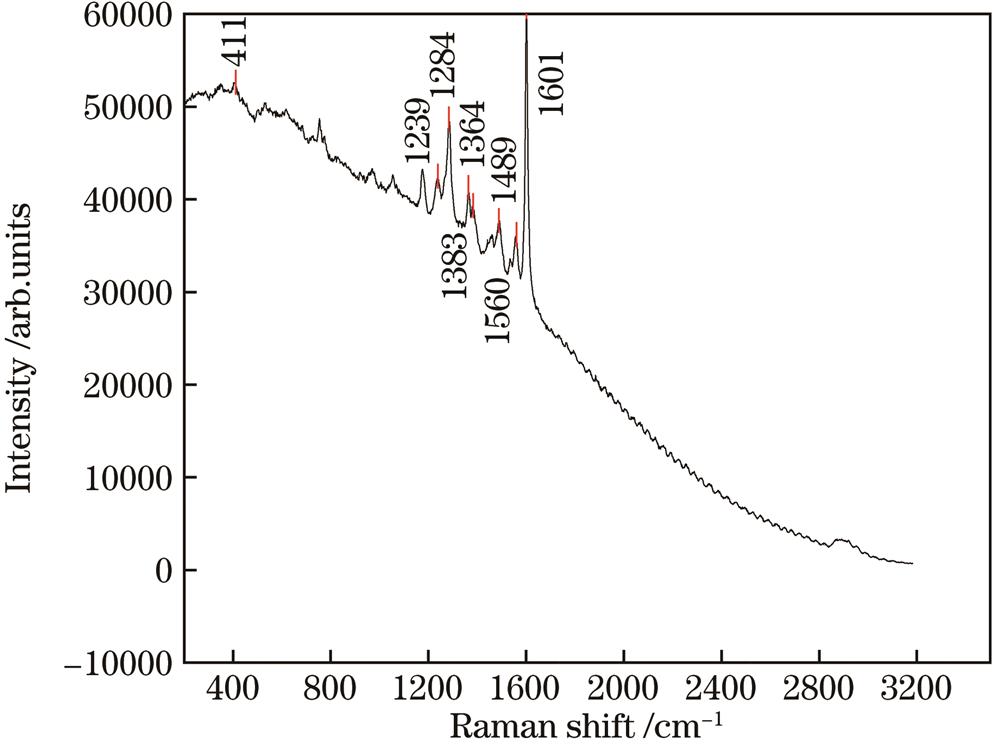
    Fig. 1. Raman spectrum of sample No.5 of class Ⅰ
    Raman spectrum of sample No.25 of classⅡ
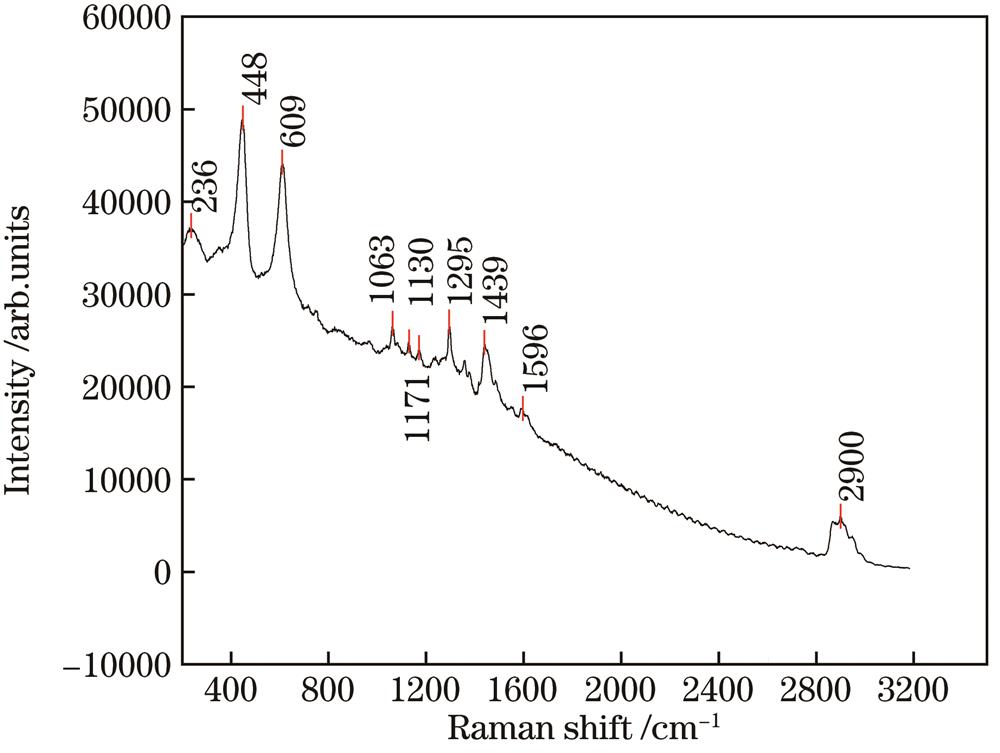
    Fig. 2. Raman spectrum of sample No.25 of classⅡ
    PCA component diagram
    Fig. 3. PCA component diagram
    Graph of Fisher discriminant analysis
    Fig. 4. Graph of Fisher discriminant analysis
    Sample numberSample nameColorSpecification /gManufacturer
    1AINAZI1#3.4Guangzhou Qidie Cosmetics Co.,Ltd.
    2AINAZI3#3.4Guangzhou Qidie Cosmetics Co.,Ltd.
    3KAQILI02#3.2Shantou Tong Cosmetic Co.,Ltd.
    4SZHOK01#3.4Guangzhou Yiliang Commodity Co.,Ltd.
    5NANI1#3.0Hangzhou Junning Cosmetics Co.,Ltd.
    6NANI4#3.0Hangzhou Junning Cosmetics Co.,Ltd.
    7NANI7#3.0Hangzhou Junning Cosmetics Co.,Ltd.
    8NANI9#3.0Hangzhou Junning Cosmetics Co.,Ltd.
    9NANI11#3.0Hangzhou Junning Cosmetics Co.,Ltd.
    10Balm20#3.0Guangdong Hengfang Biotechnology Co.,Ltd.
    11Balm118#3.0Guangdong Hengfang Biotechnology Co.,Ltd.
    12Balm127#3.0Guangdong Hengfang Biotechnology Co.,Ltd.
    13Balm130#3.0Guangdong Hengfang Biotechnology Co.,Ltd.
    14Balm131#3.0Guangdong Hengfang Biotechnology Co.,Ltd.
    15Balm134#3.0Guangdong Hengfang Biotechnology Co.,Ltd.
    16Balm135#3.0Guangdong Hengfang Biotechnology Co.,Ltd.
    17Balm136#3.0Guangdong Hengfang Biotechnology Co.,Ltd.
    18Balm142#3.0Guangdong Hengfang Biotechnology Co.,Ltd.
    19NYXKISS2#2.0Zhejiang Yanxi Cosmetics Co.,Ltd.
    20NYXKISS5#2.0Zhejiang Yanxi Cosmetics Co.,Ltd.
    21NYXKISS6#2.0Zhejiang Yanxi Cosmetics Co.,Ltd.
    22NYXKISS7#2.0Zhejiang Yanxi Cosmetics Co.,Ltd.
    23NYXKISS9#2.0Zhejiang Yanxi Cosmetics Co.,Ltd.
    24NYXKISS11#2.0Zhejiang Yanxi Cosmetics Co.,Ltd.
    25Perfect DiaryH03#2.5Guangzhou Yixian E-commerce Co.,Ltd.
    26Sealuxe201#3.2Greenleaf Suzhou Inc. All Rights Reserved
    27Sealuxe202#3.2Greenleaf Suzhou Inc. All Rights Reserved
    28Sealuxe203#3.2Greenleaf Suzhou Inc. All Rights Reserved
    Table 1. Lipstick sample table
    ClassificationSample number
    Type Ⅰ2#,3#,5#—7#,9#~15#,17#,18#,20#—24#,26#—28#
    Type Ⅱ1#,4#,8#,16#,19#,25#
    Table 2. Sample classification table
    KMO sampling appropriateness quantity0.951
    Bartlett testchi-square284376.919
    df378
    Sig.0
    Table 3. KMO and Bartlett test
    IngredientInitial eigenvalueExtract the sum of squares of the load
    TotalPercentage of variance /%Accumulation /%TotalPercentage of variance /%Accumulation /%
    123.78584.94684.94623.78584.94684.946
    23.52812.59997.5453.52812.59997.545
    Table 4. Principal component contribution rate
    1#17#24#25#
    1#Pearson correlation coefficient10.5720.6220.969
    Sig.(2-tailed)000
    17#Pearson correlation coefficient10.9630.562
    Sig.(2-tailed)00
    24#Pearson correlation coefficient10.611
    Sig.(2-tailed)0
    25#Pearson correlation coefficient1
    Sig.(2-tailed)
    Table 5. Pearson correlation analysis
    GroupChemical elementSample number
    Ⅰ-1+Cl、+Br3#、5#、9#—13#、15#、17#、20#
    Ⅰ-2+Cl、-Br7#、14#
    Ⅰ-3-Cl、+Br2#、18#、21#
    Ⅰ-4-Cl、-Br6#、22#—24#、26#—28#
    Table 6. Grouping table of typeⅠsamples
    Sample number6#22#23#24#26#27#28#
    Ratio1.600.260.860.543.143.0614.00
    Table 7. Ca/Ti ratio of samples of group I-4
    xⅠ-1(y1Ⅰ-2(y2Ⅰ-3(y3Ⅰ-4(y4
    Constant-57.408-157.361-89.787-19.743
    x18.772-14.4811.8493.529
    x2-0.621-0.283-1.030-0.462
    x3-2.1721.689-2.560-1.262
    x41.837-4.310-0.4630.750
    x50.9052.2582.8100.812
    x61.413-5.142-2.0310.322
    x71.7732.5714.3201.586
    x8-1.9336.8122.653-0.278
    x9-2.4864.402-0.759-0.810
    x103.797-10.481-2.0001.024
    x110.738-1.981-2.6000.497
    x12-2.0412.941-1.276-0.827
    x134.382-4.3443.5442.069
    x14-1.9043.7790.576-0.659
    x15-2.4505.4470.133-0.746
    x16-0.6211.252-0.524-0.099
    x170.295-0.7550.0750.041
    x18-0.872-0.319-0.511-1.158
    Table 8. Coefficient of classification function
    Jin Li, Hong Jiang, Mu Si, Minfan Chen. Study on the Classification of Lipsticks Using Raman Spectroscopy and X-Ray Fluorescence[J]. Laser & Optoelectronics Progress, 2023, 60(1): 0130001
    Download Citation