• Spectroscopy and Spectral Analysis
  • Vol. 42, Issue 11, 3380 (2022)
Chao-nan SHANG1、*, Yan-li XIE2、2;, Xiao GAO3、3;, Xue-qing ZHOU2、2;, Zhen-dong ZHAO2、2;, Jia-xin MA1、1;, Peng CUI3、3;, Xiao-xiao WEI3、3;, Yu-hong FENG1、1; 2; *;, and Ming-nan ZHANG2、2; *;
Author Affiliations
  • 11. College of Chemical Engineering and Technology, Hainan University, Haikou 570228, China
  • 22. Analysis and Test Center of Hainan University, Haikou Municipal Key Laboratories of Analysis and Test for Neo-drug Research & Development, Haikou 570228, China
  • 33. Institute of Analysis and Testing, Beijing Academy of Science and Technology (Beijing Centre for Physical and Chemical Analysis), Beijing Key Laboratory of Organic Materials Testing Technology and Quality Evaluation, Beijing 100089, China
  • show less
    DOI: 10.3964/j.issn.1000-0593(2022)11-3380-07 Cite this Article
    Chao-nan SHANG, Yan-li XIE, Xiao GAO, Xue-qing ZHOU, Zhen-dong ZHAO, Jia-xin MA, Peng CUI, Xiao-xiao WEI, Yu-hong FENG, Ming-nan ZHANG. Research on Qualitative and Quantitative Analysis of PE and EVA in Biodegradable Materials by FTIR[J]. Spectroscopy and Spectral Analysis, 2022, 42(11): 3380 Copy Citation Text show less
    ATR-FTIR spectra of PE, EVA, PBAT and PLA
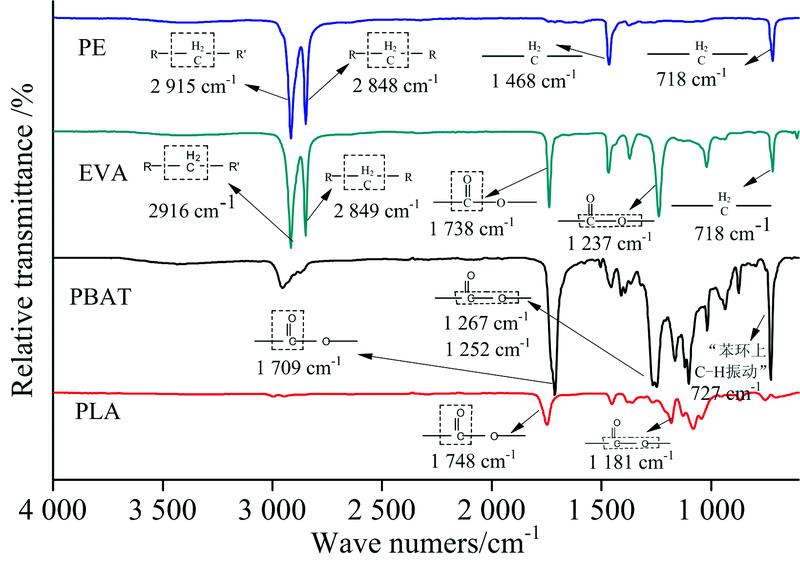
    Fig. 1. ATR-FTIR spectra of PE, EVA, PBAT and PLA
    ATR-FTIR spectra of PE-PBAT system(a): FTIR spectra; (b): Second-order derivative processing diagram of low content components
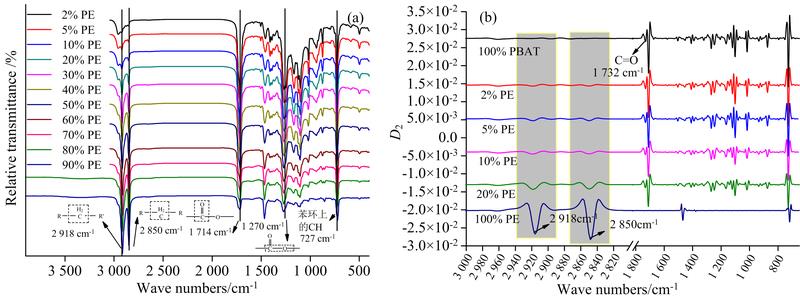
    Fig. 2. ATR-FTIR spectra of PE-PBAT system
    (a): FTIR spectra; (b): Second-order derivative processing diagram of low content components
    ATR-FTIR spectra of EVA-PBAT system(a): FTIR spectra; (b): Second-order derivative processing diagram of low content components
    Fig. 3. ATR-FTIR spectra of EVA-PBAT system
    (a): FTIR spectra; (b): Second-order derivative processing diagram of low content components
    ATR-FTIR spectra of PE-PLA system(a): FTIR spectra; (b): Second-order derivative processing diagram of low content components
    Fig. 4. ATR-FTIR spectra of PE-PLA system
    (a): FTIR spectra; (b): Second-order derivative processing diagram of low content components
    ATR-FTIR spectra of EVA- PLA system(a): FTIR spectra; (b): Second-order derivative processing diagram of low content components
    Fig. 5. ATR-FTIR spectra of EVA- PLA system
    (a): FTIR spectra; (b): Second-order derivative processing diagram of low content components
    The curve of 2 918/727 and PE content in PE-PBAT system
    Fig. 6. The curve of 2 918/727 and PE content in PE-PBAT system
    The curve of 2 918/727 and PE content in PE-PBAT system
    Fig. 7. The curve of 2 918/727 and PE content in PE-PBAT system
    The curve of 2 918/727 and EVA content in EVA-PBAT system
    Fig. 8. The curve of 2 918/727 and EVA content in EVA-PBAT system
    The curve of 2 918/1 460 and PE content in PE-PLA system
    Fig. 9. The curve of 2 918/1 460 and PE content in PE-PLA system
    The classification results of four systems[1]: EVA-PBAT; [2]: PE-PBAT; [3]: EVA-PLA; [4]: PE-PLA
    Fig. 10. The classification results of four systems
    [1]: EVA-PBAT; [2]: PE-PBAT; [3]: EVA-PLA; [4]: PE-PLA
    组分加工温度
    T/℃
    转速n
    /min-1
    扭力M
    /(N·cm)
    PE-PBAT, EVA-PBAT145±55022±5
    PE-PLA, EVA-PLA183±55030±5
    Table 1. Sample machining process parameters
    样品名称定性特征峰/cm-1基团振动
    PE2 915±5, 2 848±5, 1 468±5, 718±5长链烷烃中—CH2—的不对称和对称伸缩振动、 弯曲振动、 面内摇摆振动
    EVA2 916±5, 28 49±5, 718±5, 1 738±5, 1 237±5长链烷烃中—CH2—的不对称和对称伸缩振动、 面内摇摆振动; C=O和C—O的伸缩振动
    PBAT1 709±5, 1 267±5, 1 252±5, 727±5C=O和C—O的伸缩振动; 对位双取代苯环上的CH面外弯曲振动
    PLA1 748±5, 1 181±5C=O和C—O的伸缩振动
    Table 2. Qualitative characteristic peaksand group's vibrationof pure materials
    样品名称禁塑组分定性特征峰/cm-1禁塑组分定量特征峰/cm-1
    PE-PBAT, EVA-PBAT2 918±5, 2 850±52 918±5, 2 850±5, 1 714±5, 727±5
    PE-PLA2 918±5, 2 850±5, 718±52 918±5, 2 850±5, 1 747±5, 1 460±5
    EVA-PLA2 918±5, 2 850±5, 718±5, 1 237±52 918±5, 2 850±5, 1 740±5
    Table 3. Qualitative and quantitative characteristic peaks of blend material
    共混体系配制真实值平均
    预测值
    平均
    残差值
    标准
    偏差
    8% PE7.850.150.005 7
    15% PE13.771.230.015
    PE-PBAT25% PE23.002.000.021
    35% PE37.62-2.620.026
    45% PE46.08-1.080.026
    8% EVA7.730.270.03
    15% EVA13.071.930.03
    EVA-PBAT25% EVA23.731.270.03
    35% EVA32.402.600.03
    45% EVA45.07-0.070.03
    8% PE7.200.800.015
    15% PE14.800.200.021
    PE-PLA25% PE24.400.600.006
    35% PE34.400.600.01
    45% PE44.600.400.098
    5% EVA4.940.060.006
    10% EVA9.060.940.02
    EVA-PLA20% EVA20.24-0.240.025
    30% EVA30.24-0.240
    40% EVA39.060.940.078
    Table 4. Blind sample verification (n=3)
    Chao-nan SHANG, Yan-li XIE, Xiao GAO, Xue-qing ZHOU, Zhen-dong ZHAO, Jia-xin MA, Peng CUI, Xiao-xiao WEI, Yu-hong FENG, Ming-nan ZHANG. Research on Qualitative and Quantitative Analysis of PE and EVA in Biodegradable Materials by FTIR[J]. Spectroscopy and Spectral Analysis, 2022, 42(11): 3380
    Download Citation