
Haozhe Yan, Shangyuan Li, Zhengyang Xie, Xiaoping Zheng, Cheng Du, Hanyi Zhang, Bingkun Zhou. Deformation of orbital angular momentum modes in bending ring-core fiber[J]. Chinese Optics Letters, 2017, 15(3): 030501
- Chinese Optics Letters
- Vol. 15, Issue 3, 030501 (2017)
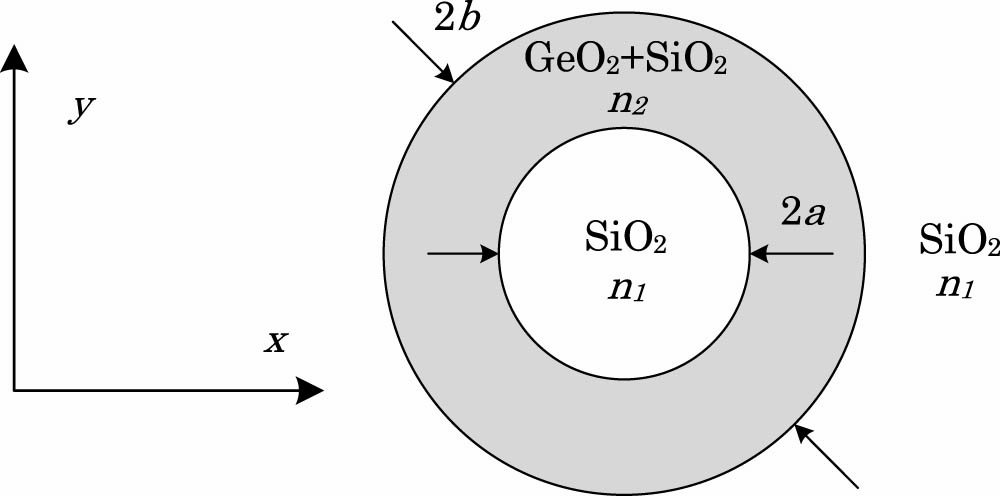
Fig. 1. Schematic diagram of the RCF cross-section.
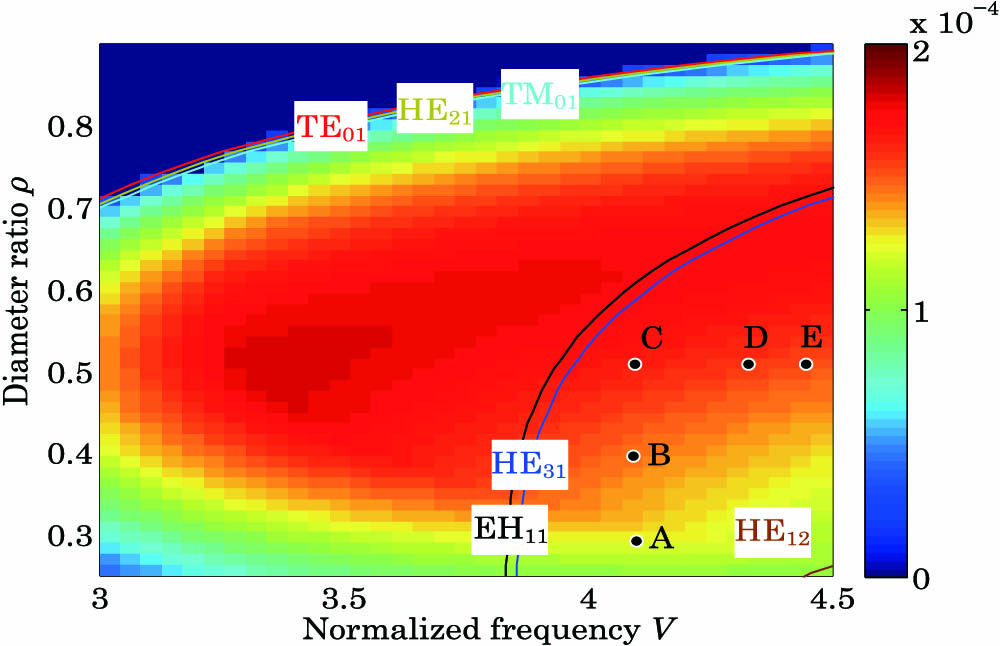
Fig. 2. Colormap of minimal Δ n eff V ρ
Fig. 3. Intensity distributions and electrical field orientations for the first higher-order eigenmodes, along with intensity and phase distributions for the composite modes in the RCF with different bending radii R R = 10 mm R = 6 mm
Fig. 4. (a) Effective refractive indices n eff Δ n eff R
Fig. 5. Conversion length L C R ρ V
Fig. 6. (a) Optical microscope image of fiber cross section for fiber 1. (b) Intensity profiles and spiral interference patterns for OAM ± 1 , 1
Fig. 7. (a) Experimental setup of the bending test. LD, semiconductor laser; CL, fiber collimator; BE, beam expander; Pol, polarizer; M, mirror; SLM, liquid crystal spatial light modulator; QWP, quarter-wave plate; LE, lens; HWP, half-wave plate; BS, non-polarizing beam-splitter. (b) Bend-post of the RCF. L θ R R = 9 mm L = 20 mm R = 9 mm L = L C = 43 mm
Fig. 8. Experimentally measured and simulated values of bending lengths versus bending radii for three RCFs.
|
Table 1. Measured Parameters of Three RCFs

Set citation alerts for the article
Please enter your email address
© Copyright 2018-2021 | Chinese Laser Press. All Rights Reserved 沪ICP备15018463号-20