
Wendan Tan, Ming Pang, Guoye Jiang, Wei Fu, Xiaohan Zhang, Dingyun Hu, Jing Cui, Guangfeng Yang. Numerical Simulation of Temperature Field in Laser Phase-Transformation Hardening of Highly-Enhanced Diesel Engine Valve Seats[J]. Laser & Optoelectronics Progress, 2018, 55(11): 111601
- Laser & Optoelectronics Progress
- Vol. 55, Issue 11, 111601 (2018)
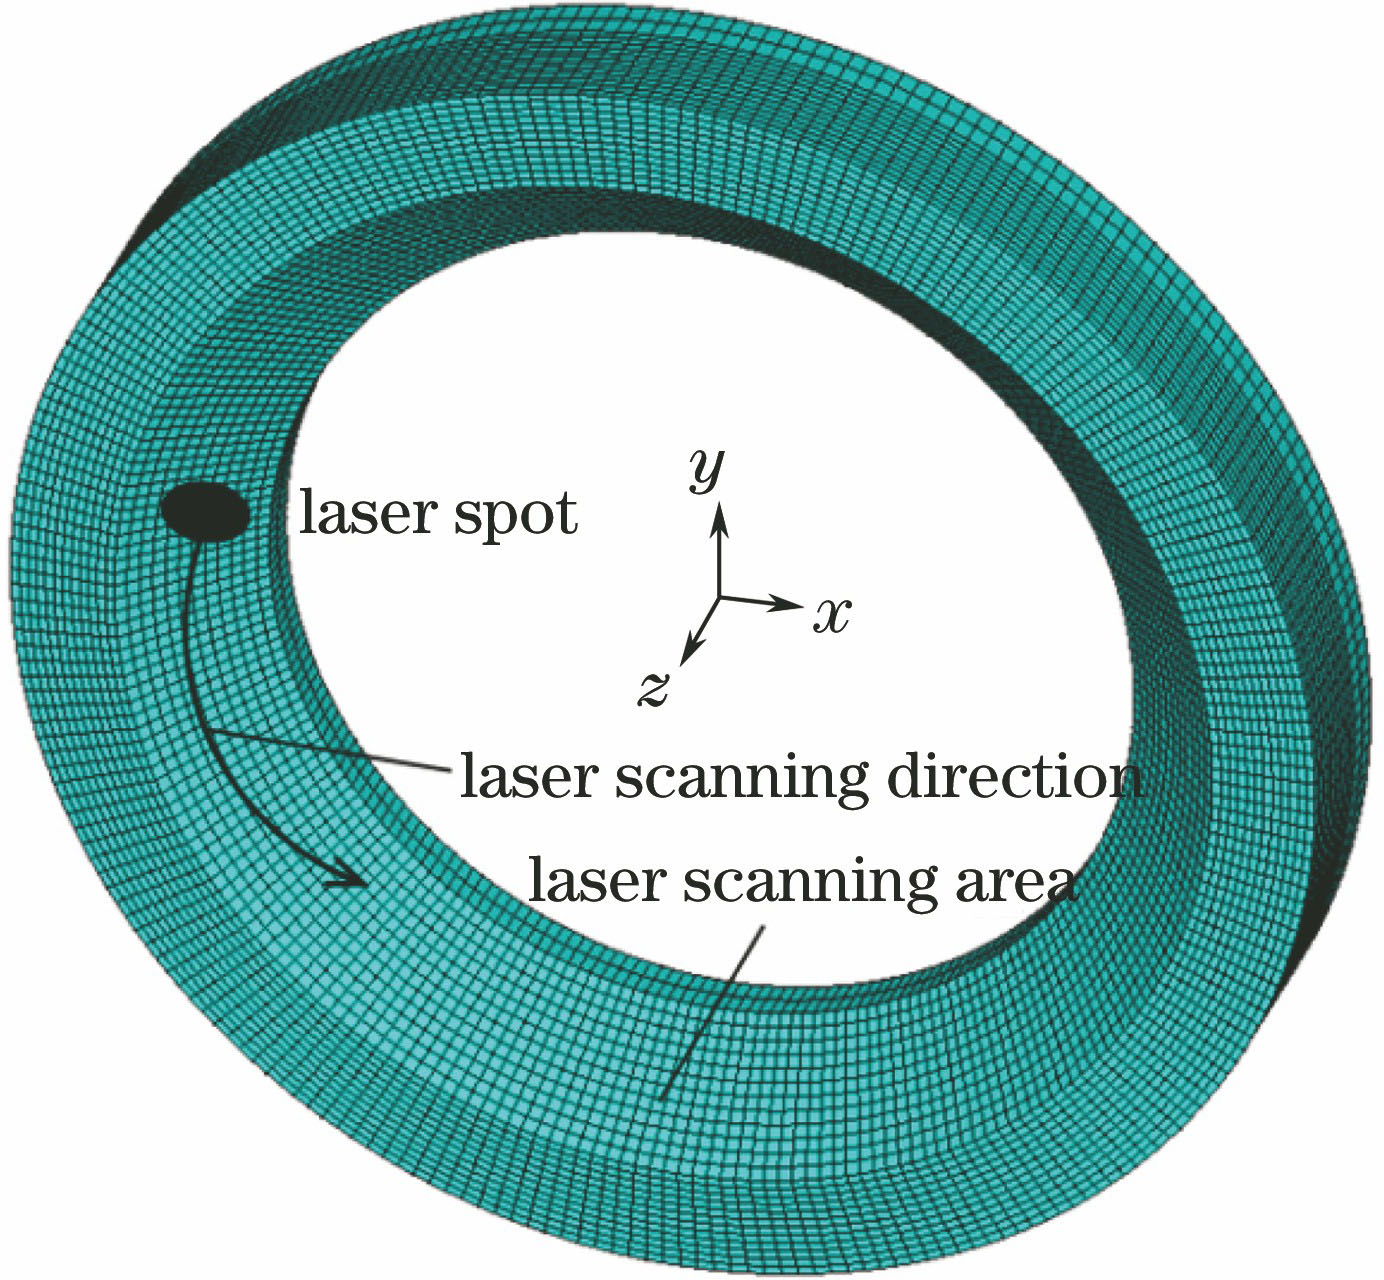
Fig. 1. Three-dimensional finite element mesh model of valve seat
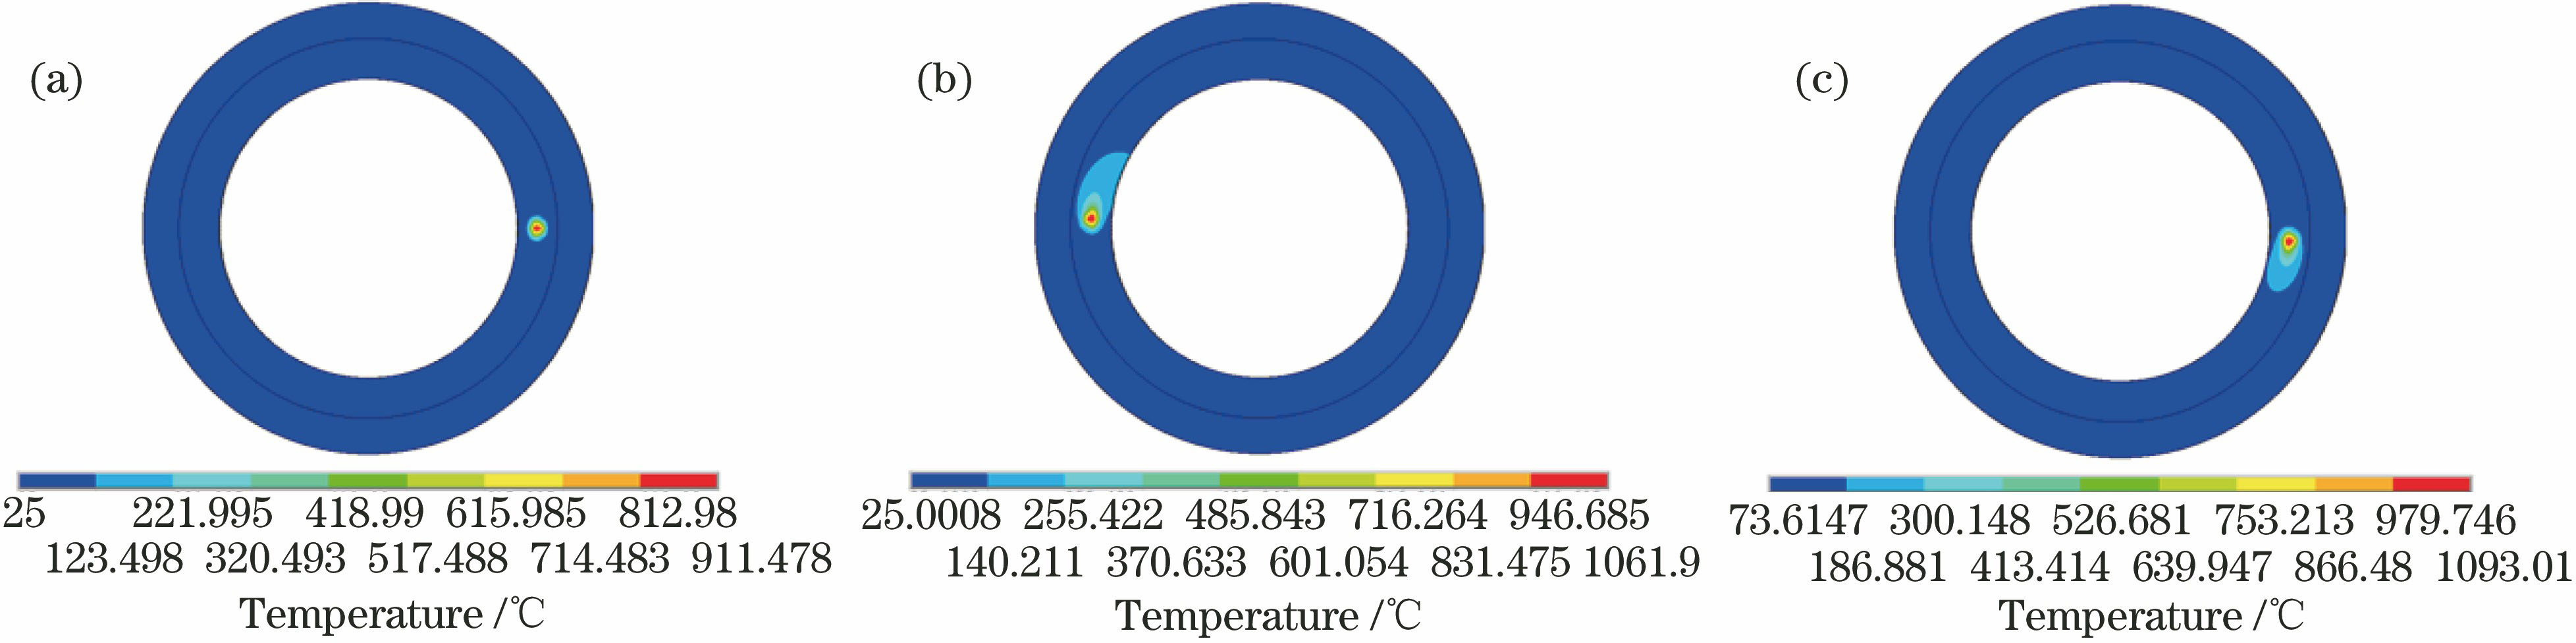
Fig. 2. Temperature field of laser phase-transformation hardening of valve seat versus time. (a) t=0.09 s; (b) t=5.4 s; (c) t=10.8 s
Fig. 3. Sectional temperature distribution of valve seat at t=10.8 s. (a) Temperature field distribution; (b) temperature contour plot
Fig. 4. Thermal cycle curves for different nodes in phase-transformation hardening area of valve seat at t=5.13 s
Fig. 5. Thermal cycle curves at peak temperature points corresponding to different time along scanning direction
Fig. 6. Temperature field distributions of valve seat for different laser powers. (a) P=1000 W; (b) P=900 W; (c) P=800 W; (d) P=700 W
Fig. 7. Peak temperature of valve seat and depth & width of hardened layer versus laser power. (a) Peak temperature of valve seat; (b) depth & width of hardened layer
Fig. 8. Temperature field distribution of valve seat versus laser scanning speed. (a) V=5 mm·s-1; (b) V=8 mm·s-1; (c) V=10 mm·s-1; (d) V=15 mm·s-1
Fig. 9. Peak temperature of valve seat and depth & width of hardened layer versus scanning speed. (a) Peak temperature of valve seat; (b) depth & width of hardened layer
Fig. 10. Temperature distribution in phase-transformation hardening area of valve seat versus laser spot radius
Fig. 11. Schematic of path nodes in inclined plane
Fig. 12. Temperature field distributions for different laser spot radii. (a) R=1.0 mm; (b) R=1.2 mm; (c) R=1.5 mm; (d) R=1.6 mm
Fig. 13. Peak temperature of valve seat and depth & width of hardened layer for different laser spot radii. (a) Peak temperature of valve seat; (b) depth & width of hardened layer
Fig. 14. Morphology of hardened layer
Fig. 15. Depth and width of hardened layer obtained by numerical simulation and experiment
|
Table 1. Thermophysical parameters of RuT300
|
Table 2. Chemical compositions of RuT300 (mass fraction, %)

Set citation alerts for the article
Please enter your email address
© Copyright 2018-2021 | Chinese Laser Press. All Rights Reserved 沪ICP备15018463号-20