• Photonics Research
  • Vol. 9, Issue 12, 2494 (2021)
Xiangzhi Xie1, Jilong Li2, Feifei Yin1, Kun Xu1, and Yitang Dai1、*
Author Affiliations
  • 1State Key Laboratory of Information Photonics and Optical Communications, Beijing University of Posts and Telecommunications, Beijing 100876, China
  • 2Advanced Institute of Photonics Technology, School of Information Engineering, and Guangdong Provincial Key Laboratory of Information Photonics Technology, Guangdong University of Technology, Guangzhou 510006, China
  • show less
    DOI: 10.1364/PRJ.438498 Cite this Article Set citation alerts
    Xiangzhi Xie, Jilong Li, Feifei Yin, Kun Xu, Yitang Dai. Low-latency full-field temporal magnification based on spectral compression[J]. Photonics Research, 2021, 9(12): 2494 Copy Citation Text show less
    (a) Configuration of the conventional temporal magnification scheme. D1, D2 are the dispersion values of the first and second dispersive elements, respectively. Df is the focal length of the time lens. Magnification factor M can be expressed as D2/D1. (b) Structure of the proposed temporal magnification scheme. FSRVCF and FSRTL represent the FSR of Vernier comb filter (VCF) and time lens, respectively. The bandwidth compression is achieved by Vernier effect, where FSRVCF is slightly larger than FSRTL. Magnification factor M can be expressed as FSRVCF/(FSRVCF−FSRTL).
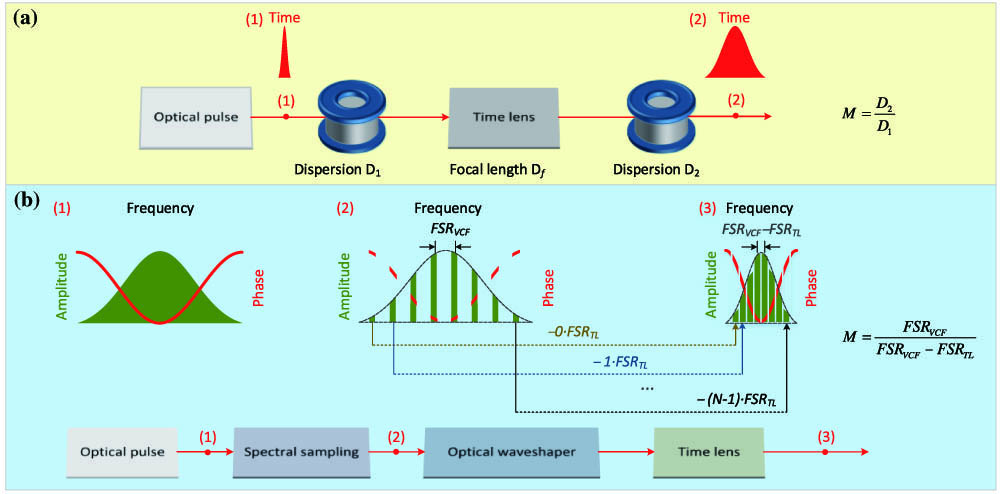
    Fig. 1. (a) Configuration of the conventional temporal magnification scheme. D1, D2 are the dispersion values of the first and second dispersive elements, respectively. Df is the focal length of the time lens. Magnification factor M can be expressed as D2/D1. (b) Structure of the proposed temporal magnification scheme. FSRVCF and FSRTL represent the FSR of Vernier comb filter (VCF) and time lens, respectively. The bandwidth compression is achieved by Vernier effect, where FSRVCF is slightly larger than FSRTL. Magnification factor M can be expressed as FSRVCF/(FSRVCFFSRTL).
    Experimental setup for the real-time full-field measurements. A programmable laser is used to produce ultrafast optical signals with specific amplitude and phase characteristics. MZM, Mach–Zehnder modulator; PM, phase modulator; CW laser, continuous-wave laser; BPD, balanced photodetector. The time lens consists of an MZM and two PMs.
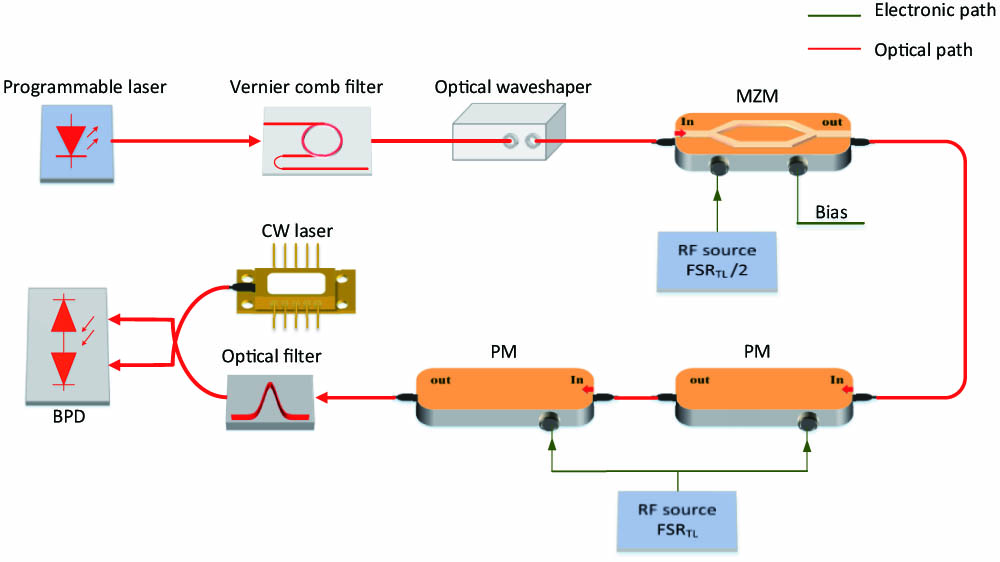
    Fig. 2. Experimental setup for the real-time full-field measurements. A programmable laser is used to produce ultrafast optical signals with specific amplitude and phase characteristics. MZM, Mach–Zehnder modulator; PM, phase modulator; CW laser, continuous-wave laser; BPD, balanced photodetector. The time lens consists of an MZM and two PMs.
    Relationship between the magnification factor and the FSR difference. (a), (b), and (c), respectively, represent the output temporal waveform when FSRVCF−FSRTL is equal to 140, 100, and 50 MHz. Dotted line: Input waveform obtained by numerical simulation. Solid line: Measured output waveform. Red horizontal is for the input waveform; black horizontal is for the output waveform.
    Fig. 3. Relationship between the magnification factor and the FSR difference. (a), (b), and (c), respectively, represent the output temporal waveform when FSRVCFFSRTL is equal to 140, 100, and 50 MHz. Dotted line: Input waveform obtained by numerical simulation. Solid line: Measured output waveform. Red horizontal is for the input waveform; black horizontal is for the output waveform.
    Real time full-field measurements for intensity-modulated spectrum. (a) and (b), respectively, represent the comparison of the input pulse (numerical) and output pulse (measured), corresponding to the FSR difference of 140 and 120 MHz. The dotted line represents the input waveforms obtained by numerical simulation; the solid line represents the experimental results. Dark blue line: intensity of temporal waveform. Orange line: phase of temporal waveform. (c) Measured spectrum of input optical signal. (d) and (e), respectively, represent the output spectrum when the FSR difference is 140 and 120 MHz.
    Fig. 4. Real time full-field measurements for intensity-modulated spectrum. (a) and (b), respectively, represent the comparison of the input pulse (numerical) and output pulse (measured), corresponding to the FSR difference of 140 and 120 MHz. The dotted line represents the input waveforms obtained by numerical simulation; the solid line represents the experimental results. Dark blue line: intensity of temporal waveform. Orange line: phase of temporal waveform. (c) Measured spectrum of input optical signal. (d) and (e), respectively, represent the output spectrum when the FSR difference is 140 and 120 MHz.
    Real-time full-field measurements for phase-modulated spectrum. (a) and (b), respectively, represent the comparison of the input pulse (numerical) and output pulse (measured), corresponding to the FSR difference of 170 and 120 MHz. Dotted line represents the input waveform obtained by numerical simulation; the solid line represents the experimental result. Dark blue line: the intensity of temporal waveform. Orange line: phase of temporal waveform. (c) Measured spectrum of input optical signal. (d) and (e), respectively, represent the output spectrum when the FSR difference is 170 and 120 MHz.
    Fig. 5. Real-time full-field measurements for phase-modulated spectrum. (a) and (b), respectively, represent the comparison of the input pulse (numerical) and output pulse (measured), corresponding to the FSR difference of 170 and 120 MHz. Dotted line represents the input waveform obtained by numerical simulation; the solid line represents the experimental result. Dark blue line: the intensity of temporal waveform. Orange line: phase of temporal waveform. (c) Measured spectrum of input optical signal. (d) and (e), respectively, represent the output spectrum when the FSR difference is 170 and 120 MHz.
    Xiangzhi Xie, Jilong Li, Feifei Yin, Kun Xu, Yitang Dai. Low-latency full-field temporal magnification based on spectral compression[J]. Photonics Research, 2021, 9(12): 2494
    Download Citation