• Acta Optica Sinica
  • Vol. 40, Issue 10, 1011002 (2020)
Jinci Bi1、**, Zhishan Gao1, Dan Zhu1, Jianqiu Ma1, Qun Yuan1, Zhenyan Guo1, Yi Qu2、*, Changjun Yin3, and Yao Xu4
Author Affiliations
  • 1School of Electronic and Optical Engineering, Nanjing University of Science and Technology, Nanjing, Jiangsu 210094, China
  • 2School of Automation, Nanjing University of Science and Technology, Nanjing, Jiangsu 210094, China
  • 3Jiangsu Province Hospital of Chinese Medicine, Nanjing, Jiangsu 210029, China
  • 4Jiangsu Shuguang Opto-Electronics Co. Ltd., Yangzhou, Jiangsu 225109, China
  • show less
    DOI: 10.3788/AOS202040.1011002 Cite this Article Set citation alerts
    Jinci Bi, Zhishan Gao, Dan Zhu, Jianqiu Ma, Qun Yuan, Zhenyan Guo, Yi Qu, Changjun Yin, Yao Xu. An Optical Coherence Tomographic Aberration Correction Method Based on the Particle Swarm Optimization Algorithm[J]. Acta Optica Sinica, 2020, 40(10): 1011002 Copy Citation Text show less
    Aberration correction model
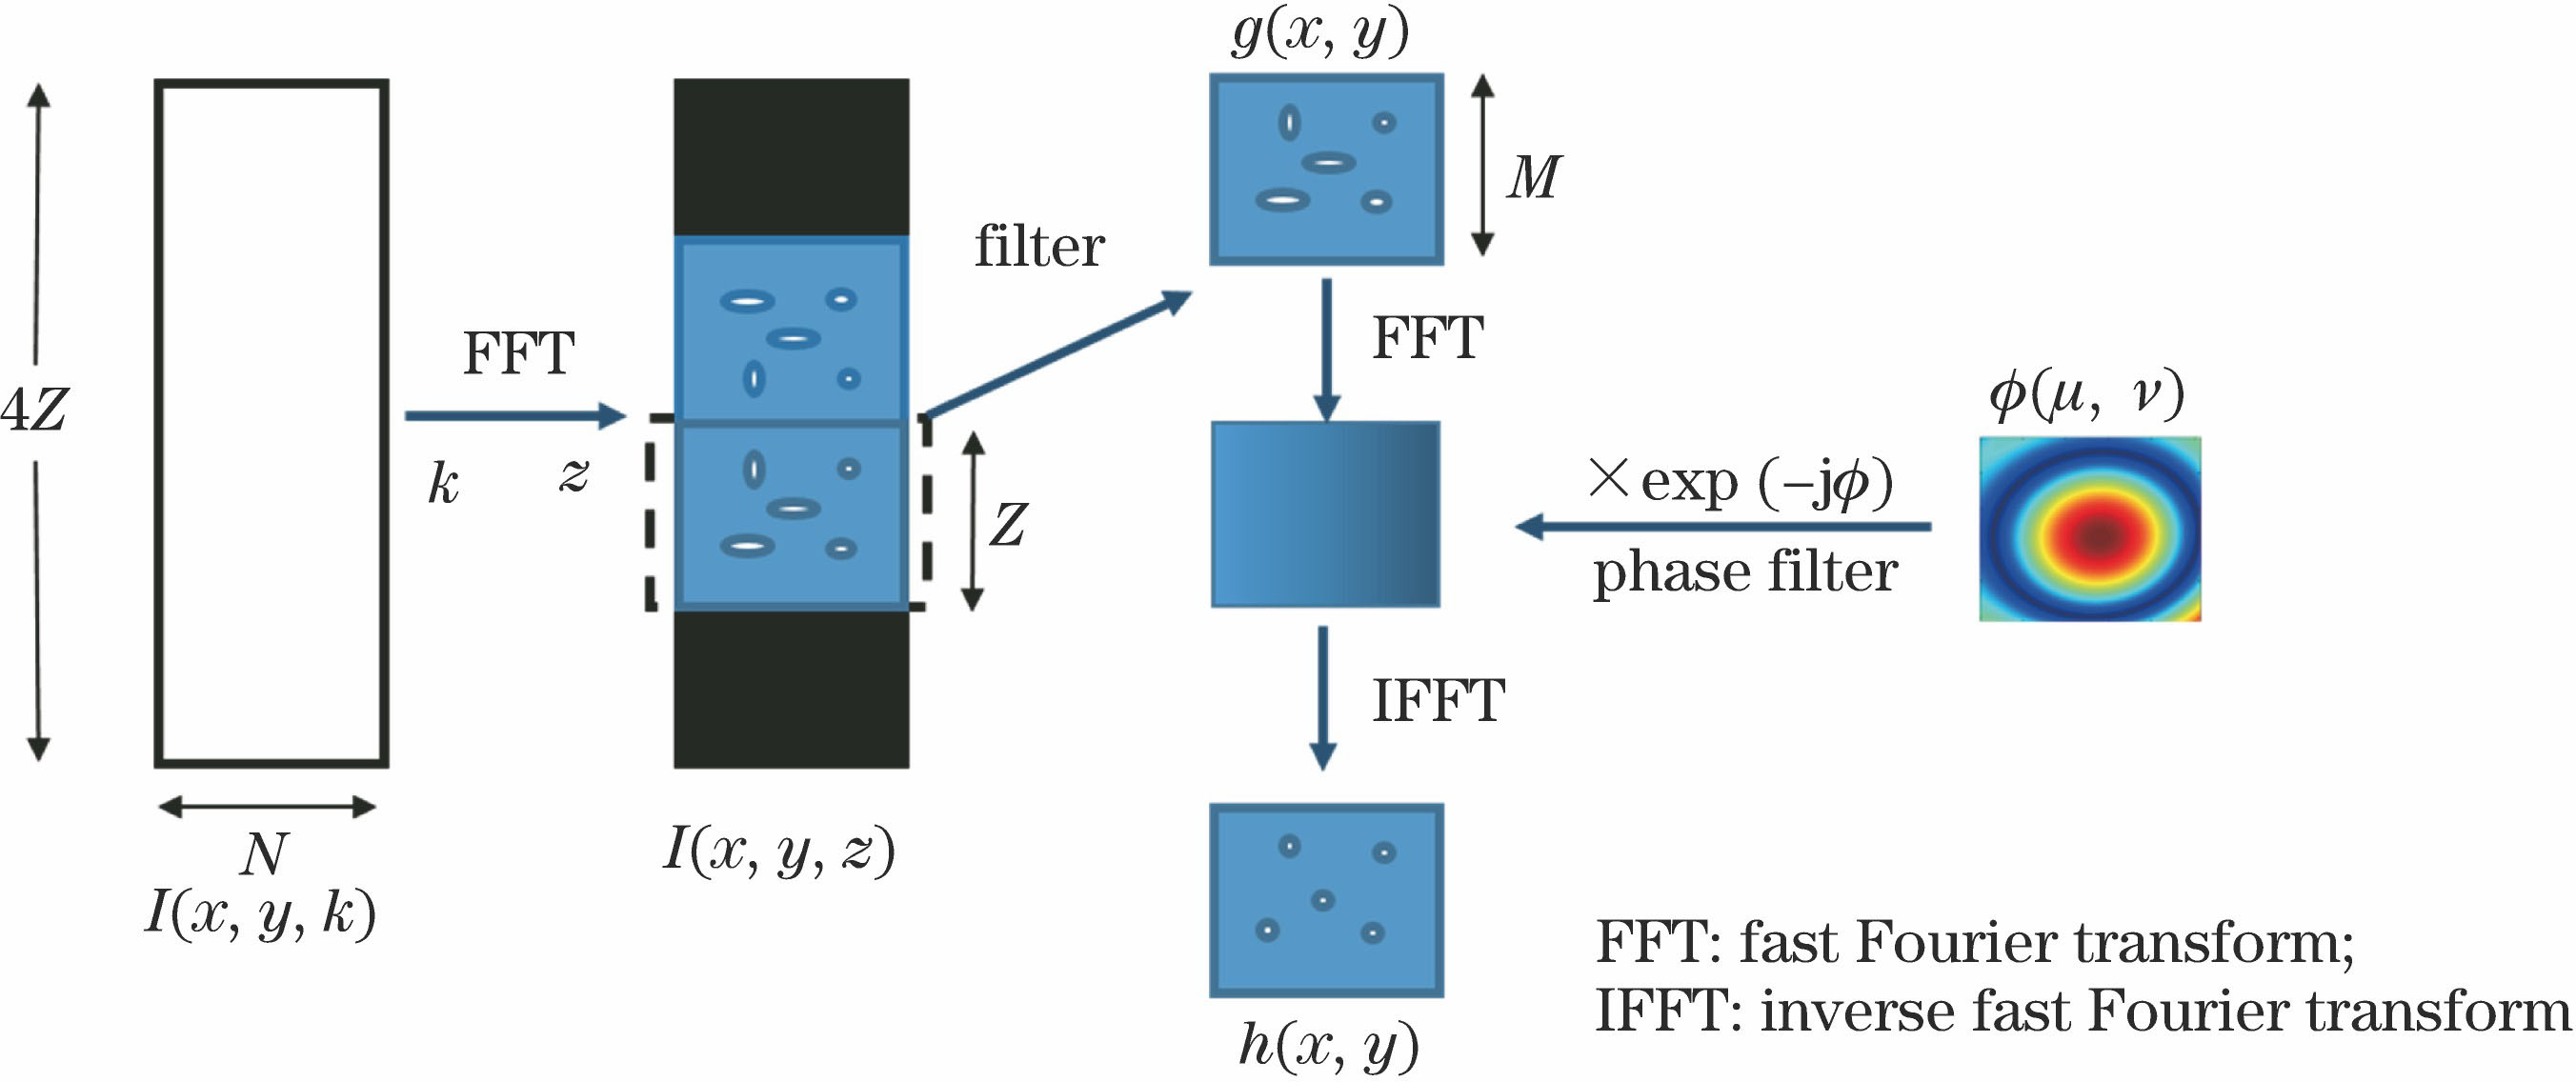
    Fig. 1. Aberration correction model
    Flow chart of particle swarm optimization
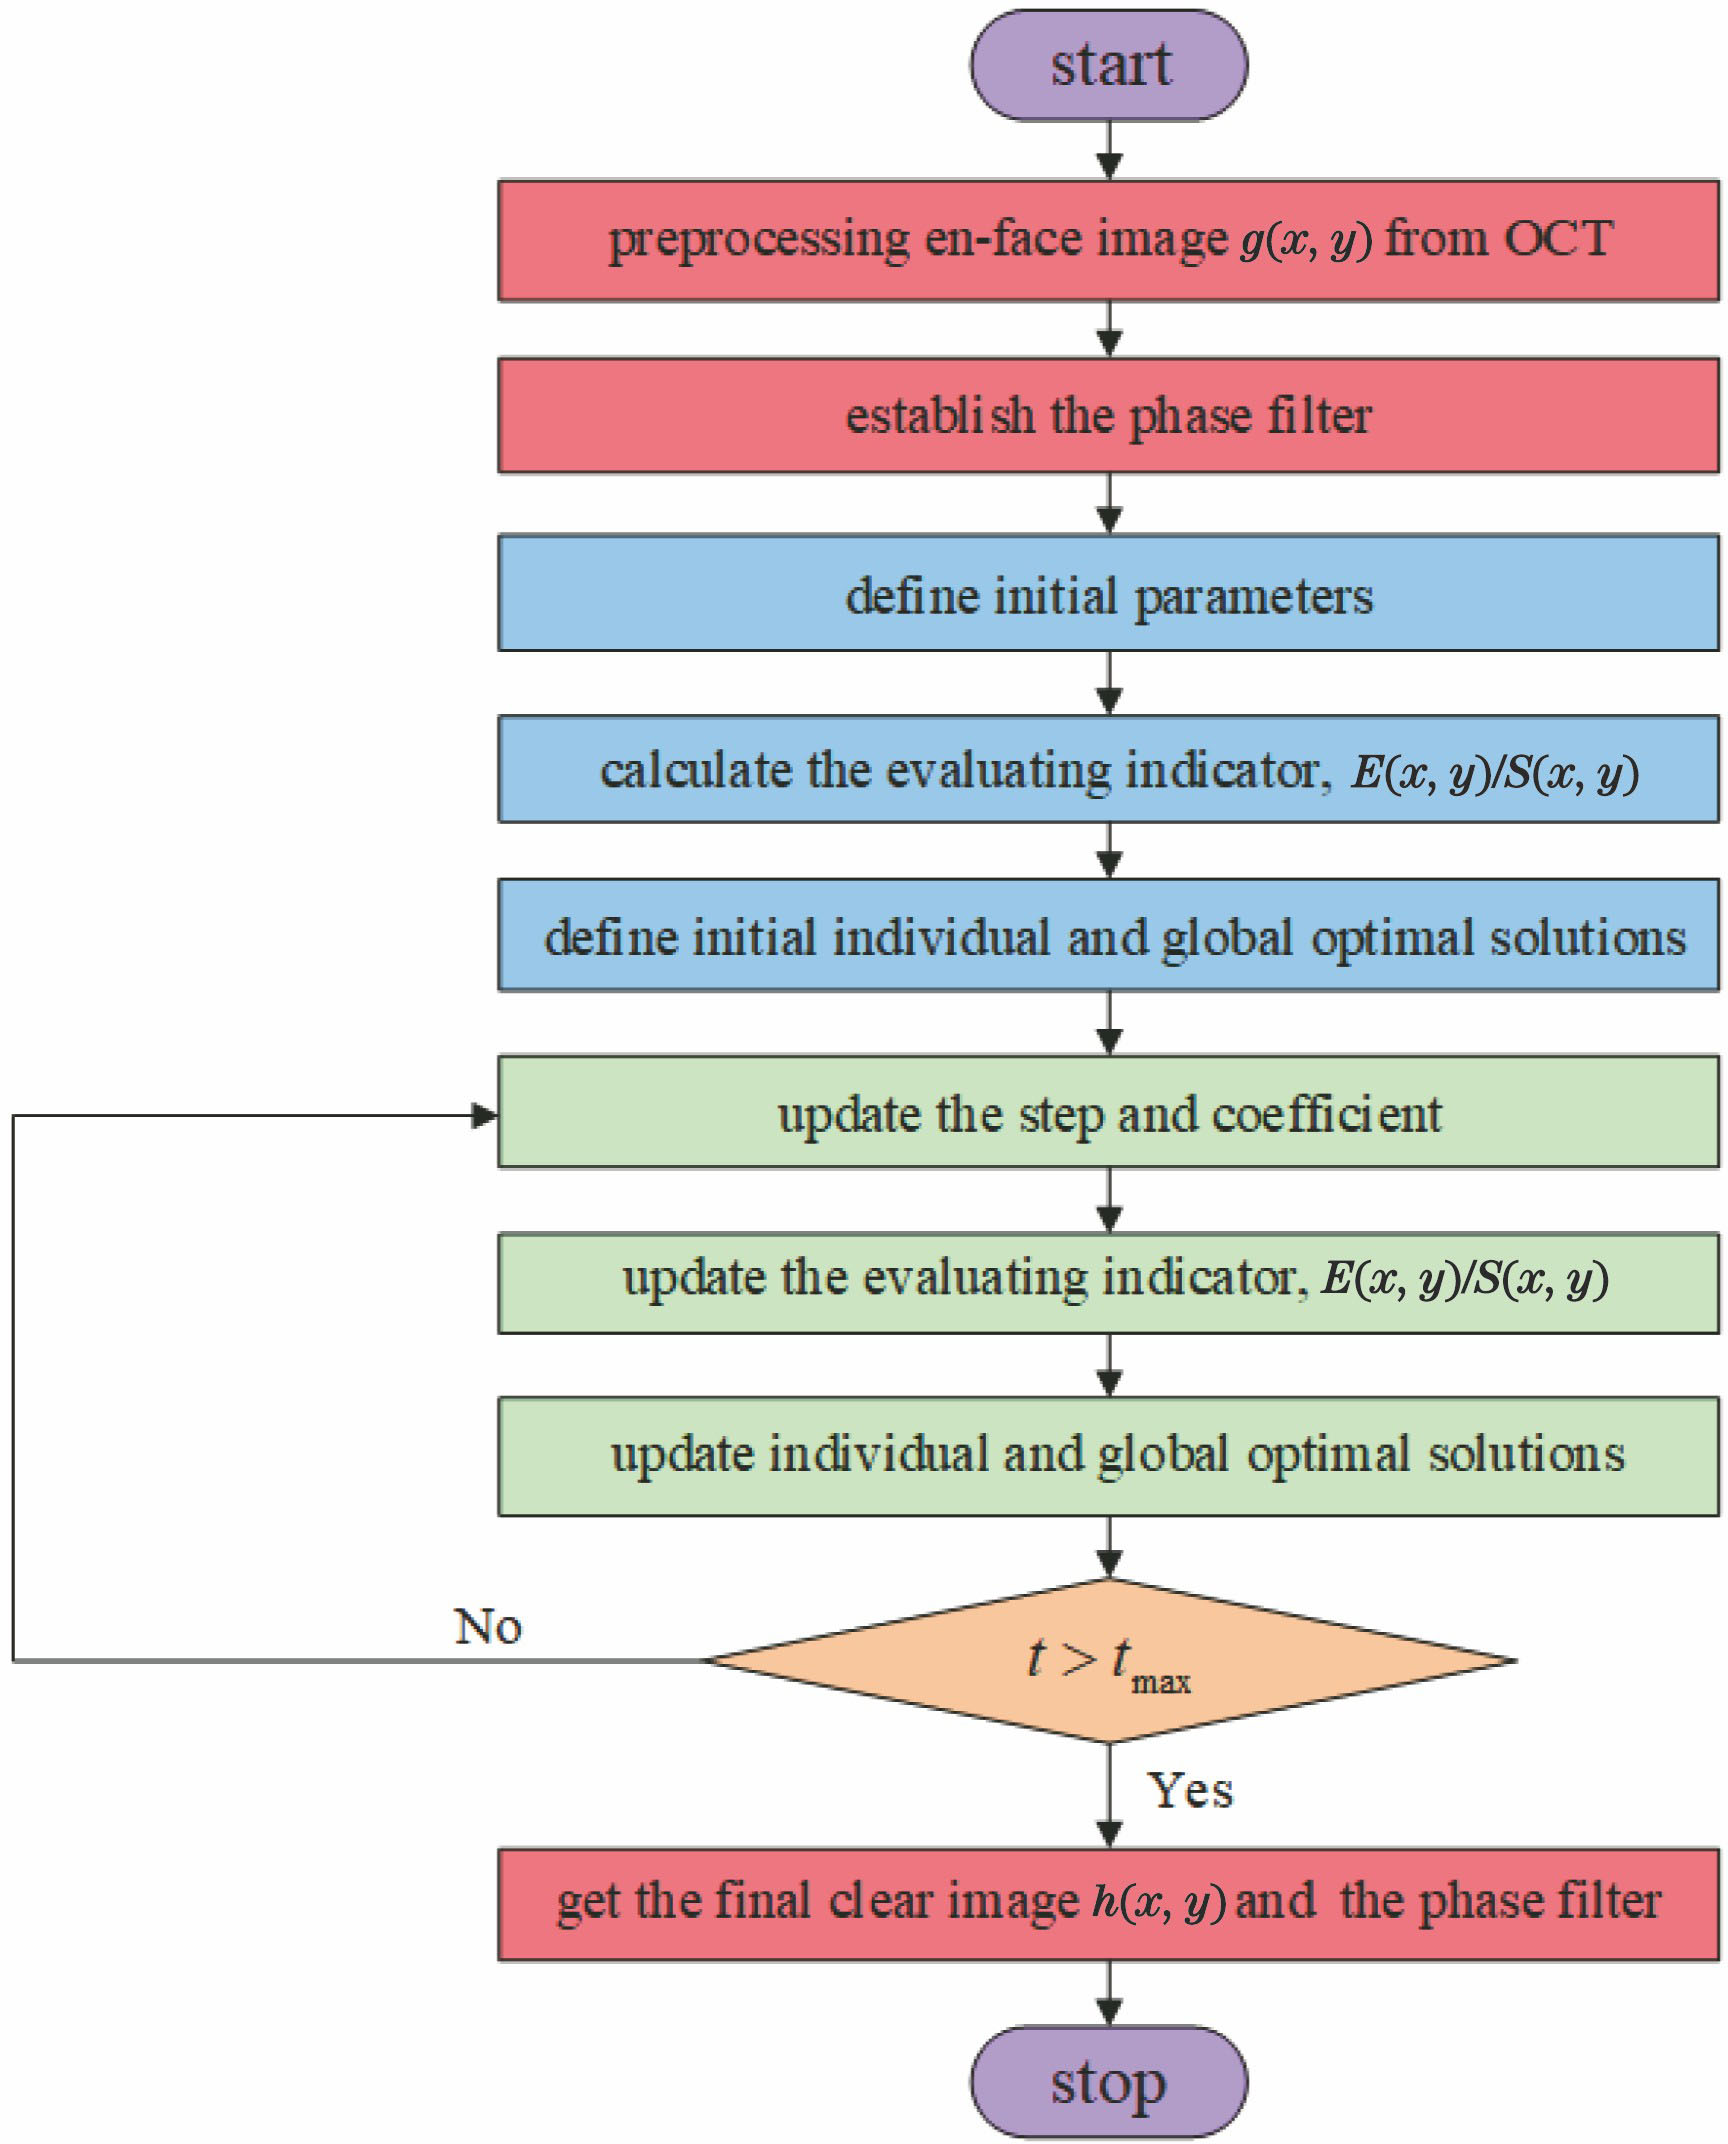
    Fig. 2. Flow chart of particle swarm optimization
    Simulation results of defocused wavefront aberration. (a) Loaded defocused wavefront; (b) blurred image; (c) recovered wavefront residual distribution; (d) defocused image
    Fig. 3. Simulation results of defocused wavefront aberration. (a) Loaded defocused wavefront; (b) blurred image; (c) recovered wavefront residual distribution; (d) defocused image
    Simulation results of low-order mixed wavefront aberration. (a) Loaded low-order mixed wavefront aberration; (b) blurred image; (c)(d) reconstructed wavefront residual distribution and clear image with image information entropy as evaluation index; (e)(f) reconstructed wavefront residual distribution and clear image with image claritas evaluation index
    Fig. 4. Simulation results of low-order mixed wavefront aberration. (a) Loaded low-order mixed wavefront aberration; (b) blurred image; (c)(d) reconstructed wavefront residual distribution and clear image with image information entropy as evaluation index; (e)(f) reconstructed wavefront residual distribution and clear image with image claritas evaluation index
    Comparison of Zernike polynomials coefficients of wavefront aberration loaded and restored
    Fig. 5. Comparison of Zernike polynomials coefficients of wavefront aberration loaded and restored
    Experimental images of onion cells. (a) OCT tomogram; (b) en-face image
    Fig. 6. Experimental images of onion cells. (a) OCT tomogram; (b) en-face image
    Onion tissue cell images. (a) Blurred image to be corrected; (b) clear image
    Fig. 7. Onion tissue cell images. (a) Blurred image to be corrected; (b) clear image
    Grape tissue cell images. (a) Image to be corrected; (b) clear image
    Fig. 8. Grape tissue cell images. (a) Image to be corrected; (b) clear image
    Type of target image typePixel sizeType of aberrationProcessing time /s
    Resolution plate (Fig. 3)256×256Defocus8
    Resolution plate (Fig. 4)256×256Defocus, astigmatism, coma and spherical aberration55
    Table 1. Efficiency analysis of correcting wavefront aberrations of simulation
    Jinci Bi, Zhishan Gao, Dan Zhu, Jianqiu Ma, Qun Yuan, Zhenyan Guo, Yi Qu, Changjun Yin, Yao Xu. An Optical Coherence Tomographic Aberration Correction Method Based on the Particle Swarm Optimization Algorithm[J]. Acta Optica Sinica, 2020, 40(10): 1011002
    Download Citation