
Yu-Ming Yin, Ling-Ling Zhao. Effects of salt concentrations and pore surface structure on the water flow through rock nanopores [J]. Acta Physica Sinica, 2020, 69(5): 054701-1
- Acta Physica Sinica
- Vol. 69, Issue 5, 054701-1 (2020)
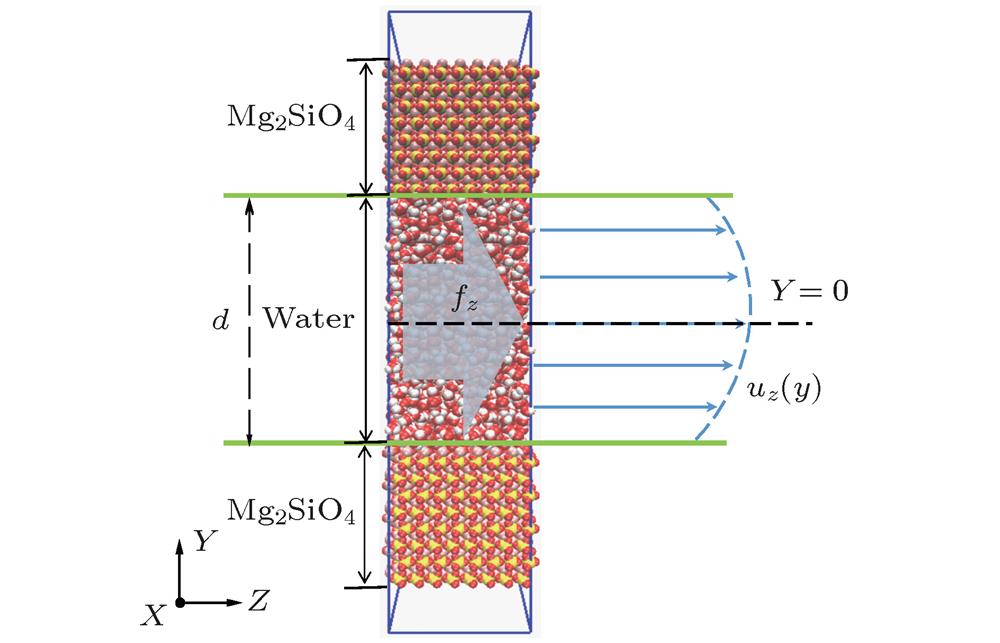
Fig. 1. The simulation system of water solution flow in the forsterite nanopore.
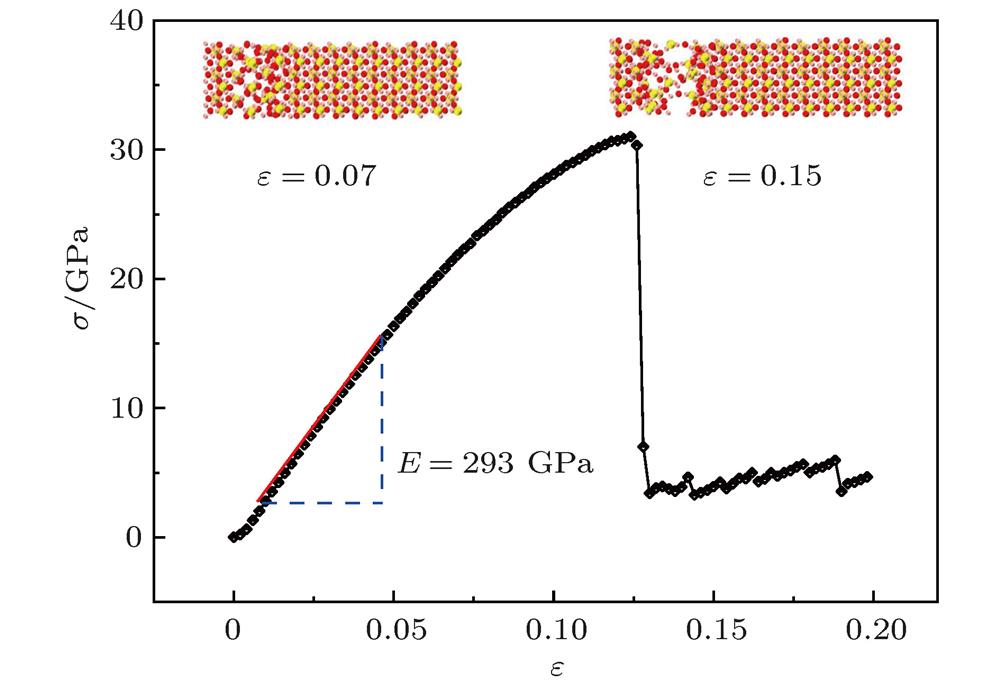
Fig. 2. The stress-strain curves of the Mg2SiO4 crystal stretching obtained using molecular dynamics simulation.
Fig. 3. (a) Snapshots for the solvation shell with a radius of 0.4 nm in pure water and MgCl2 solution, (b) the velocity profiles in the +Z direction of water solution in the forsterite nanopore with different MgCl2 concentrations.
Fig. 4. (a) The viscosity and hydrogen bond density of water solution with different MgCl2 concentrations; (b) the radial distribution function of Ow-Ow near the wall of nanopores.
Fig. 5. The radial distribution function of Mg-Ow near the wall of nanopores.
Fig. 6. The schematic of forsterite nanopores with various degrees of surface structure destruction.
Fig. 7. The velocity profiles in the +Z direction of water solution in forsterite nanopores with various degrees of surface structure destruction.
Fig. 8. The density profiles of water solution in forsterite nanopores with various degrees of surface structure destruction.

Set citation alerts for the article
Please enter your email address
© Copyright 2018-2021 | Chinese Laser Press. All Rights Reserved 沪ICP备15018463号-20