• Acta Optica Sinica
  • Vol. 40, Issue 19, 1930002 (2020)
Yi Ding1、2、3, Haiyan Luo1、2、3、*, Hailiang Shi1、2、3, Zhiwei Li1、3, Yunfei Han1、2、3, and Wei Xiong1、2、3
Author Affiliations
  • 1Anhui Institute of Optics and Fine Mechanics, Hefei Institute of Physical Science, Chinese Academy of Sciences, Hefei, Anhui 230031, China
  • 2University of Science and Technology of China, Hefei, Anhui 230026, China
  • 3Key Laboratory of Optical Calibration and Characterization of Chinese Academy of Sciences, Hefei, Anhui 230031, China
  • show less
    DOI: 10.3788/AOS202040.1930002 Cite this Article Set citation alerts
    Yi Ding, Haiyan Luo, Hailiang Shi, Zhiwei Li, Yunfei Han, Wei Xiong. New Flat-Field Correction Method for Spatial Heterodyne Spectrometer[J]. Acta Optica Sinica, 2020, 40(19): 1930002 Copy Citation Text show less
    Spatial heterodyne spectrometer. (a) Schematic of optical path; (b) monolithic SHS interferometer
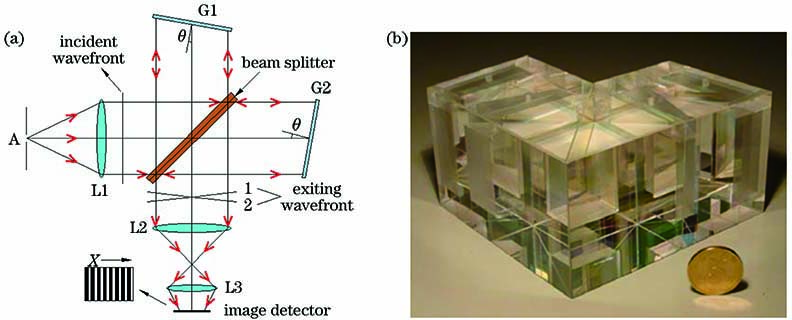
    Fig. 1. Spatial heterodyne spectrometer. (a) Schematic of optical path; (b) monolithic SHS interferometer
    Variation of interference intensity in the direction of dispersion at different wavelengths
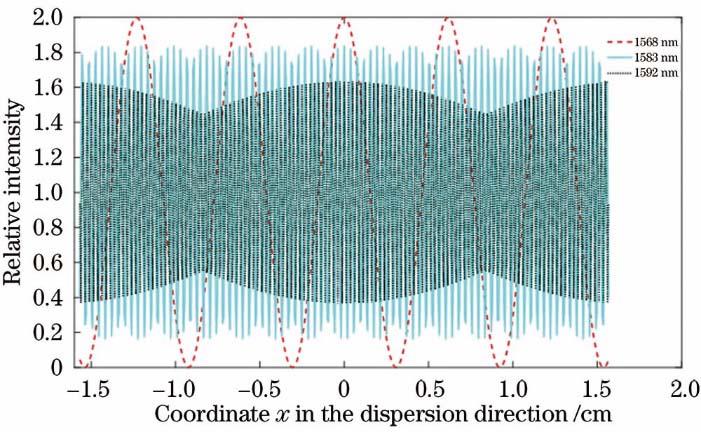
    Fig. 2. Variation of interference intensity in the direction of dispersion at different wavelengths
    Relationship between wavenumber and modulation
    Fig. 3. Relationship between wavenumber and modulation
    Simulation results
    Fig. 4. Simulation results
    Transmittance curve of the flat-field correction filter
    Fig. 5. Transmittance curve of the flat-field correction filter
    Layout of experimental breadboard
    Fig. 6. Layout of experimental breadboard
    Relative illumination curve of the system(selected characteristic wavelengths of the interference working filter and flat-field filter are 1575 nm and 1500 nm, respectively)
    Fig. 7. Relative illumination curve of the system(selected characteristic wavelengths of the interference working filter and flat-field filter are 1575 nm and 1500 nm, respectively)
    Experimental results. (a) Interferogram of flat-field filter; (b) interferogram of working filter
    Fig. 8. Experimental results. (a) Interferogram of flat-field filter; (b) interferogram of working filter
    Comparison between single-row flat-field data and interference data
    Fig. 9. Comparison between single-row flat-field data and interference data
    Comparison of flat-field correction effect. (a) Interferogram before flat-field correction; (b) interferogram after flat-field correction
    Fig. 10. Comparison of flat-field correction effect. (a) Interferogram before flat-field correction; (b) interferogram after flat-field correction
    Comparison of single-row interference data before and after flat-field correction
    Fig. 11. Comparison of single-row interference data before and after flat-field correction
    Effect of flat-field correction on recovery spectrum
    Fig. 12. Effect of flat-field correction on recovery spectrum
    ParameterValue
    Littrow wavelength /μm (Wave number /cm-1)1.567(6381.6)
    Spectral range /nm(Wave number /cm-1)1568--1583(6317--6377)
    Grating density /(line·mm-1)250
    Spectral resolution /nm0.1
    Magnification of imaging system-0.317∶1
    Grating size /cm3.134
    Pixel size-20 μm640×512
    Table 1. Main parameters of CO2 spatial heterodyne spectrometer
    ParameterBefore flat-field correctionAfter flat-field correction
    r-SNR35.175.7
    Relative intensity of high-frequency /%10.01.6
    Fixed frequency noiseNon-correctedCorrected
    Table 2. Effects of flat-field correction
    Yi Ding, Haiyan Luo, Hailiang Shi, Zhiwei Li, Yunfei Han, Wei Xiong. New Flat-Field Correction Method for Spatial Heterodyne Spectrometer[J]. Acta Optica Sinica, 2020, 40(19): 1930002
    Download Citation