• Photonics Research
  • Vol. 11, Issue 7, 1314 (2023)
Dongning Liu1, Jingyuan Liu1, Xiaosong Ren1, Xue Feng1, Fang Liu1, Kaiyu Cui1, Yidong Huang1、2, and Wei Zhang1、2、*
Author Affiliations
  • 1Frontier Science Center for Quantum Information, Beijing National Research Center for Information Science and Technology (BNRist), Electronic Engineering Department, Tsinghua University, Beijing 100084, China
  • 2Beijing Academy of Quantum Information Sciences, Beijing 100193, China
  • show less
    DOI: 10.1364/PRJ.489139 Cite this Article Set citation alerts
    Dongning Liu, Jingyuan Liu, Xiaosong Ren, Xue Feng, Fang Liu, Kaiyu Cui, Yidong Huang, Wei Zhang. Photonic-reconfigurable entanglement distribution network based on silicon quantum photonics[J]. Photonics Research, 2023, 11(7): 1314 Copy Citation Text show less
    Chip and the network topology. (a) Design of the silicon quantum photonic chip for the PR-EDN. The entangled photon pairs are generated in six long silicon waveguides by SFWM and distributed to different users by quantum interference and passive beam splitting. (b) Microscope photograph of the fabricated chip sample. The chip supports a PR-EDN with three subnets, which are denoted by Subnets 1, 2 and 3, respectively. Each subnet has eight users. We choose two users in each subnet to show the states of network topology at different configurations, which are denoted by (c) intra-subnet state, (d) inter-subnet state, and (e) all-subnet state.
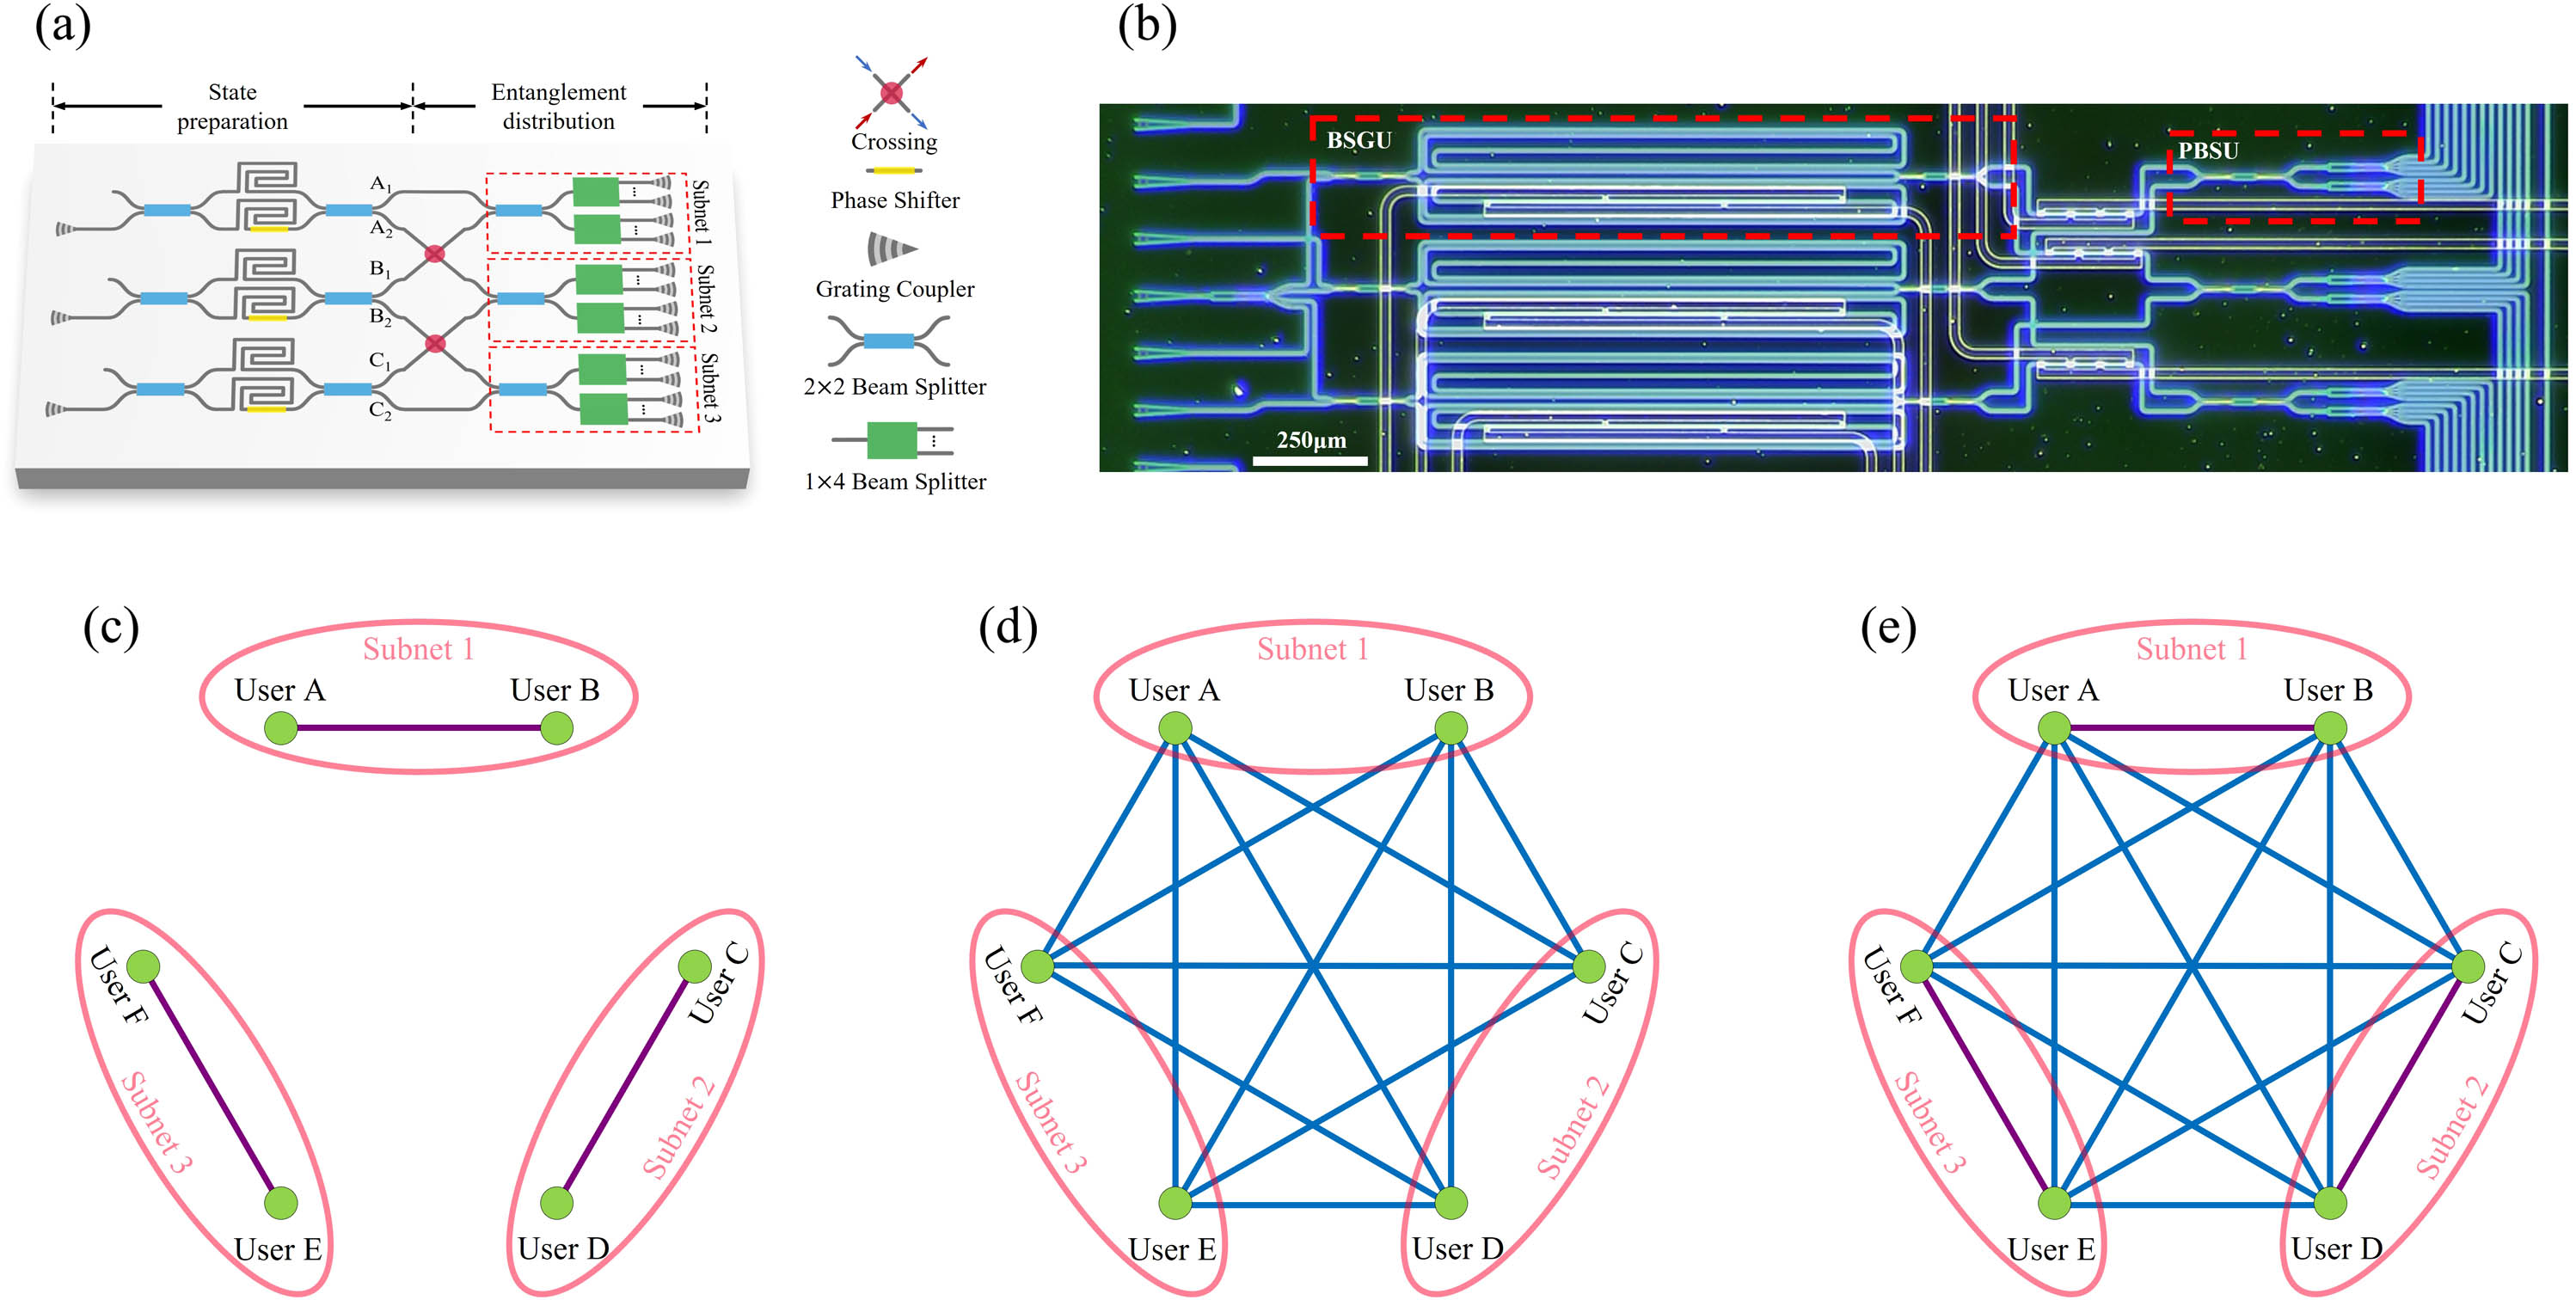
    Fig. 1. Chip and the network topology. (a) Design of the silicon quantum photonic chip for the PR-EDN. The entangled photon pairs are generated in six long silicon waveguides by SFWM and distributed to different users by quantum interference and passive beam splitting. (b) Microscope photograph of the fabricated chip sample. The chip supports a PR-EDN with three subnets, which are denoted by Subnets 1, 2 and 3, respectively. Each subnet has eight users. We choose two users in each subnet to show the states of network topology at different configurations, which are denoted by (c) intra-subnet state, (d) inter-subnet state, and (e) all-subnet state.
    Experimental setup and the results of entanglement distribution. (a) Experimental setup for the PR-EDN based on a silicon quantum photonic chip. In the experiment, we select two representative users from each subnet to demonstrate the characteristics of PR-EDN. They are users A and B of Subnet 1, users C and D of Subnet 2, and users E and F of Subnet 3. (b) Setup at user ends for Franson-type interference. (c) Setup at user ends for symmetric entanglement-based DO-QKD. (d)–(f) Results of coincidence counting between selected users at (d) intra-subnet state, (e) inter-subnet state, and (f) all-subnet state.
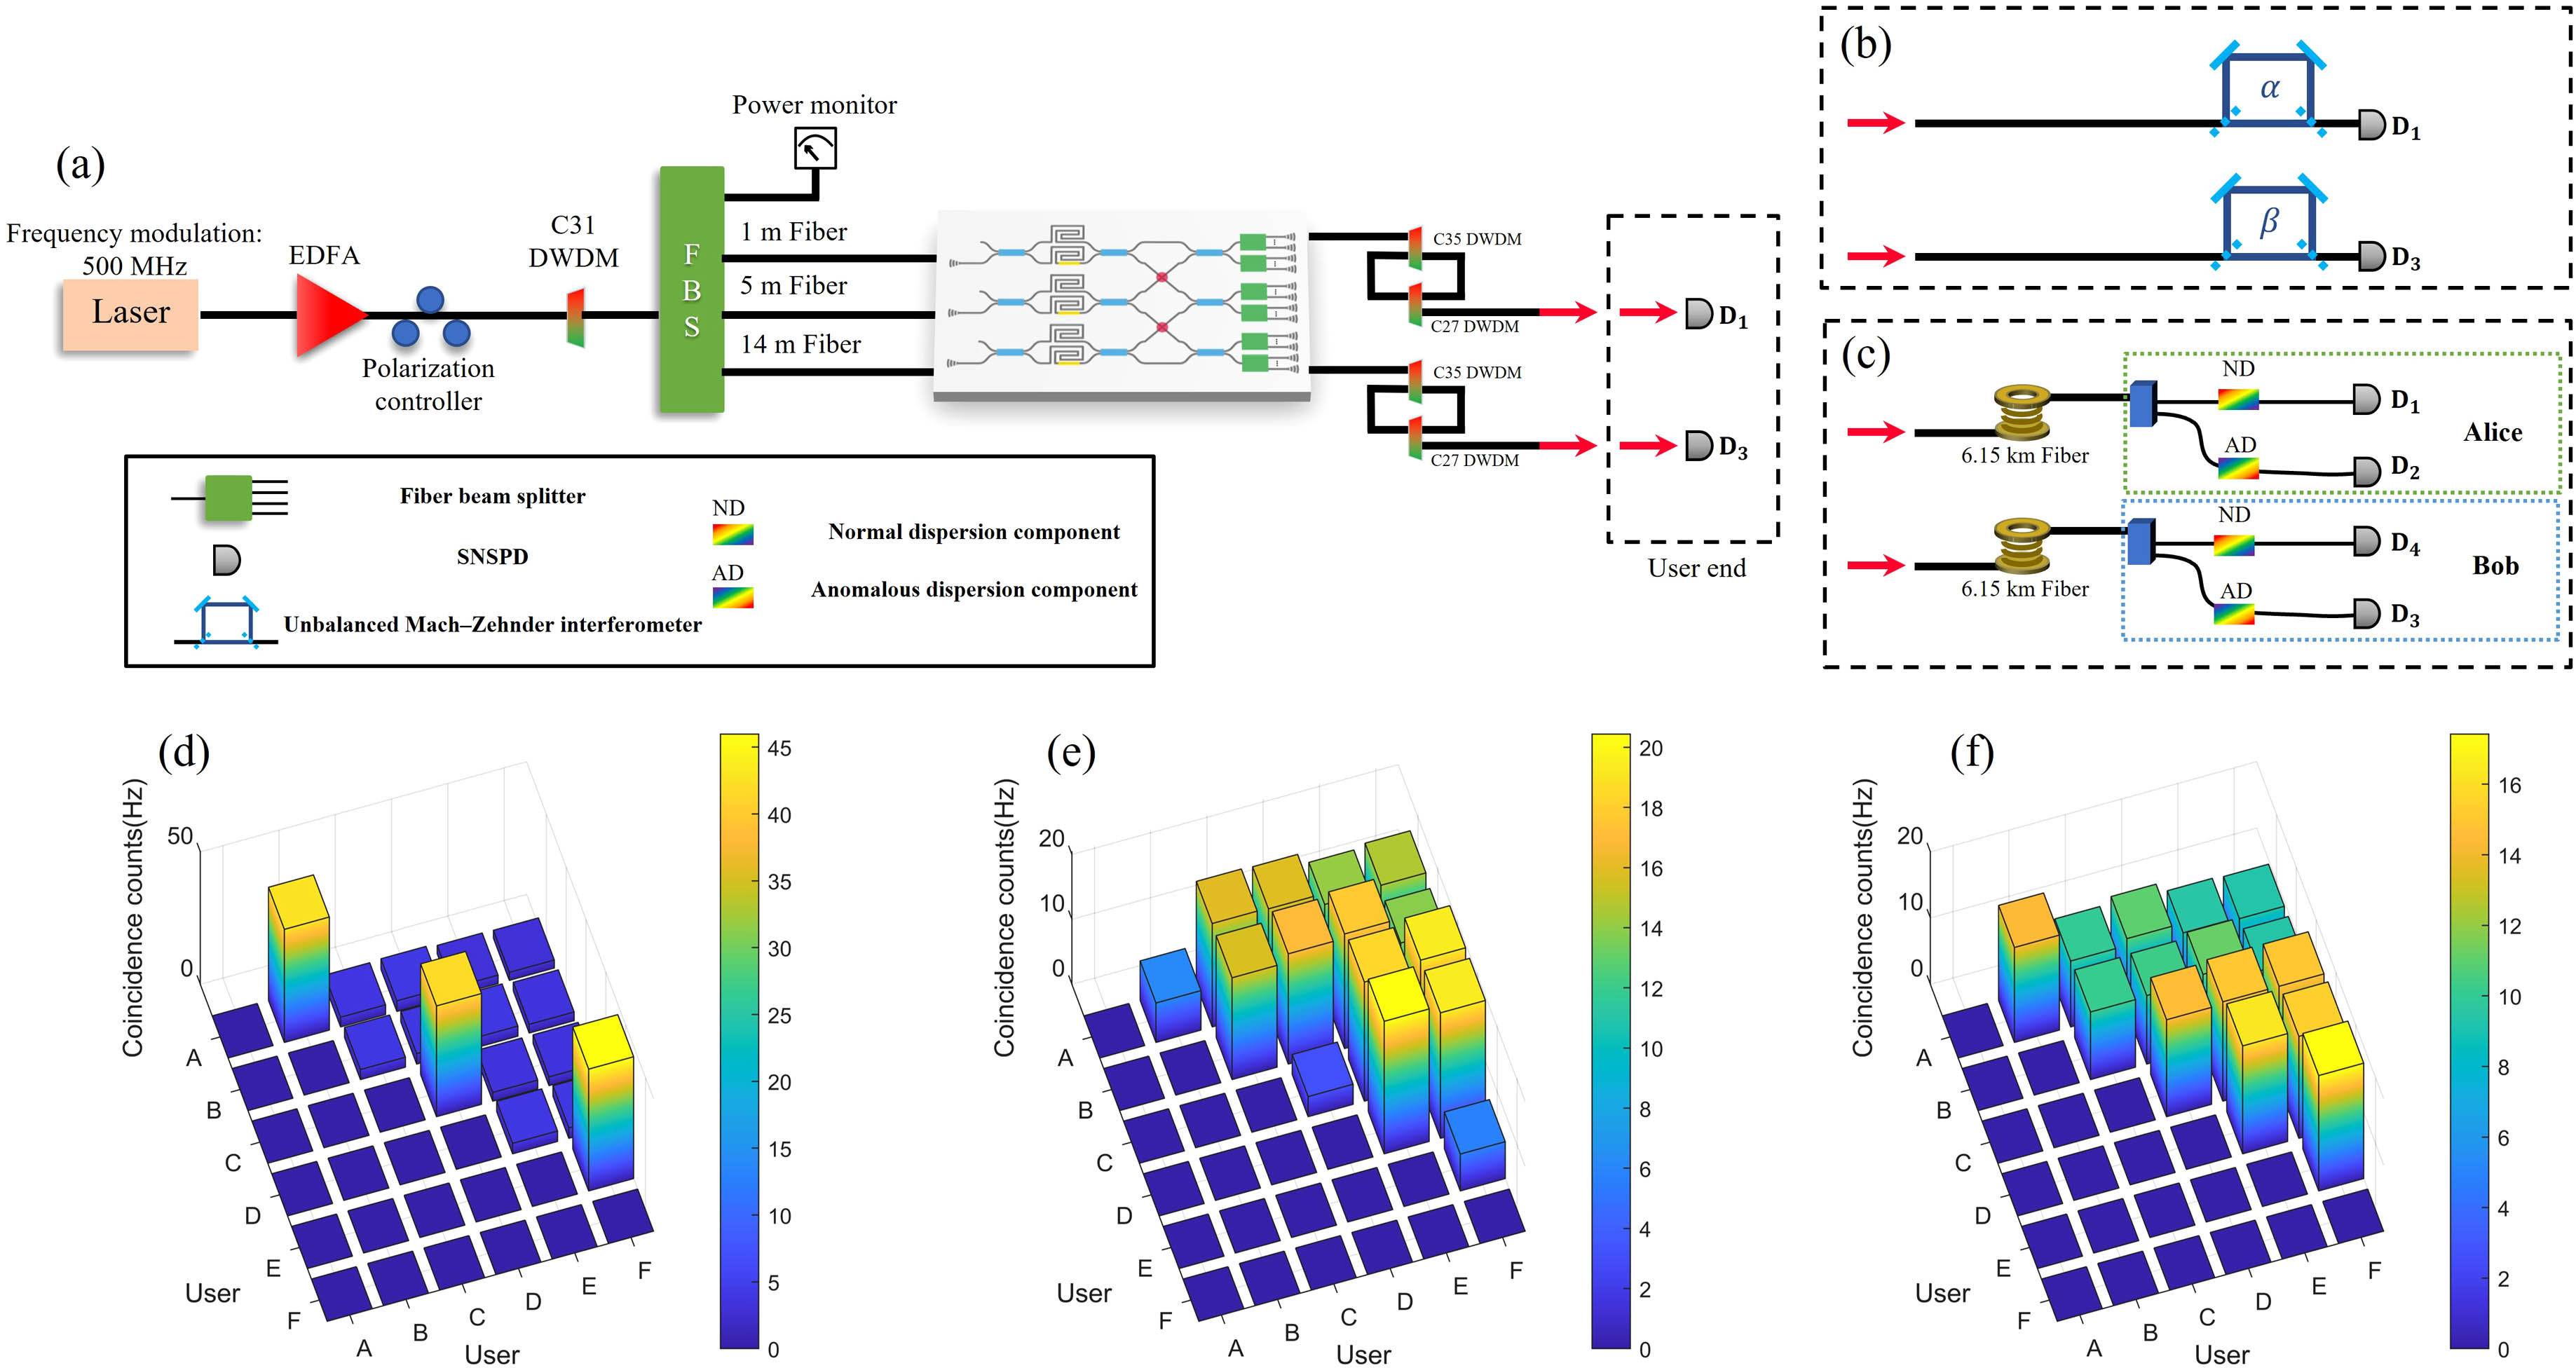
    Fig. 2. Experimental setup and the results of entanglement distribution. (a) Experimental setup for the PR-EDN based on a silicon quantum photonic chip. In the experiment, we select two representative users from each subnet to demonstrate the characteristics of PR-EDN. They are users A and B of Subnet 1, users C and D of Subnet 2, and users E and F of Subnet 3. (b) Setup at user ends for Franson-type interference. (c) Setup at user ends for symmetric entanglement-based DO-QKD. (d)–(f) Results of coincidence counting between selected users at (d) intra-subnet state, (e) inter-subnet state, and (f) all-subnet state.
    Experimental results of Franson-type interference. Typical results of time-resolved coincidence counting in the experiment of Franson-type interference on the link between users A and F, when the center peak of coincidence counts reaches its (a) minimum and (b) maximum. (c) Two-photon interference fringes measured in the experiment of Franson-type interference on the link between users A and F. The blue and purple points are experimental data measured under two mutually unbiased bases, respectively. We perform coincidence measurements for 300 s for each data point. Error bars come from the Poisson distribution of photons. The blue and purple lines are their fitting curves. Here, β is represented by the squares of the voltages on the corresponding UMZIs. (d) Raw visibilities of the Franson-type interference on all the 15 links among users A–F. All of them are higher than the local hidden variable (LHV) limit (70.7%).
    Fig. 3. Experimental results of Franson-type interference. Typical results of time-resolved coincidence counting in the experiment of Franson-type interference on the link between users A and F, when the center peak of coincidence counts reaches its (a) minimum and (b) maximum. (c) Two-photon interference fringes measured in the experiment of Franson-type interference on the link between users A and F. The blue and purple points are experimental data measured under two mutually unbiased bases, respectively. We perform coincidence measurements for 300 s for each data point. Error bars come from the Poisson distribution of photons. The blue and purple lines are their fitting curves. Here, β is represented by the squares of the voltages on the corresponding UMZIs. (d) Raw visibilities of the Franson-type interference on all the 15 links among users A–F. All of them are higher than the local hidden variable (LHV) limit (70.7%).
    Experimental results of the reconfigurable QKD network. Secure key rates of all the 15 links among the six users (users A–F) of the network at the (a) intra-subnet state, (b) inter-subnet state, and (c) all-subnet state. The secure keys are generated by the symmetric entanglement-based DO-QKD.
    Fig. 4. Experimental results of the reconfigurable QKD network. Secure key rates of all the 15 links among the six users (users A–F) of the network at the (a) intra-subnet state, (b) inter-subnet state, and (c) all-subnet state. The secure keys are generated by the symmetric entanglement-based DO-QKD.
    Coincidence counts of two users in different subnets under increasing TOPS voltage in the corresponding BSGU. The voltages indicated by the blue, red, and yellow arrows represent the values supporting the intra-subnet state, inter-subnet state, and all-subnet state, respectively. Error bars come from the Poisson distribution of photons.
    Fig. 5. Coincidence counts of two users in different subnets under increasing TOPS voltage in the corresponding BSGU. The voltages indicated by the blue, red, and yellow arrows represent the values supporting the intra-subnet state, inter-subnet state, and all-subnet state, respectively. Error bars come from the Poisson distribution of photons.
    Coupling efficiency between the on-chip grating couplers and optical fibers. The blue region is the wavelength range of photon pair generation. The yellow region is the wavelength range with the highest coupling efficiency, which is ∼−4.5 dB.
    Fig. 6. Coupling efficiency between the on-chip grating couplers and optical fibers. The blue region is the wavelength range of photon pair generation. The yellow region is the wavelength range with the highest coupling efficiency, which is 4.5  dB.
    Detail performance of the reconfigurable QKD network. (a)–(c) Measured raw key rates, (d)–(f) QBERs, and (g)–(i) secure key rates in finite-size regime at the intra-subnet state, inter-subnet state, and all-subnet state, respectively.
    Fig. 7. Detail performance of the reconfigurable QKD network. (a)–(c) Measured raw key rates, (d)–(f) QBERs, and (g)–(i) secure key rates in finite-size regime at the intra-subnet state, inter-subnet state, and all-subnet state, respectively.
    Experimental results of the Franson type interference on all the links among the six representative users (users A–F).
    Fig. 8. Experimental results of the Franson type interference on all the links among the six representative users (users A–F).
    Dongning Liu, Jingyuan Liu, Xiaosong Ren, Xue Feng, Fang Liu, Kaiyu Cui, Yidong Huang, Wei Zhang. Photonic-reconfigurable entanglement distribution network based on silicon quantum photonics[J]. Photonics Research, 2023, 11(7): 1314
    Download Citation