

 ]
]


 ]
]
 ]
]

 ]
]


 ]
]


D. B. Schaeffer, L. R. Hofer, E. N. Knall, P. V. Heuer, C. G. Constantin, C. Niemann. A platform for high-repetition-rate laser experiments on the Large Plasma Device[J]. High Power Laser Science and Engineering, 2018, 6(2): 02000e17
- High Power Laser Science and Engineering
- Vol. 6, Issue 2, 02000e17 (2018)
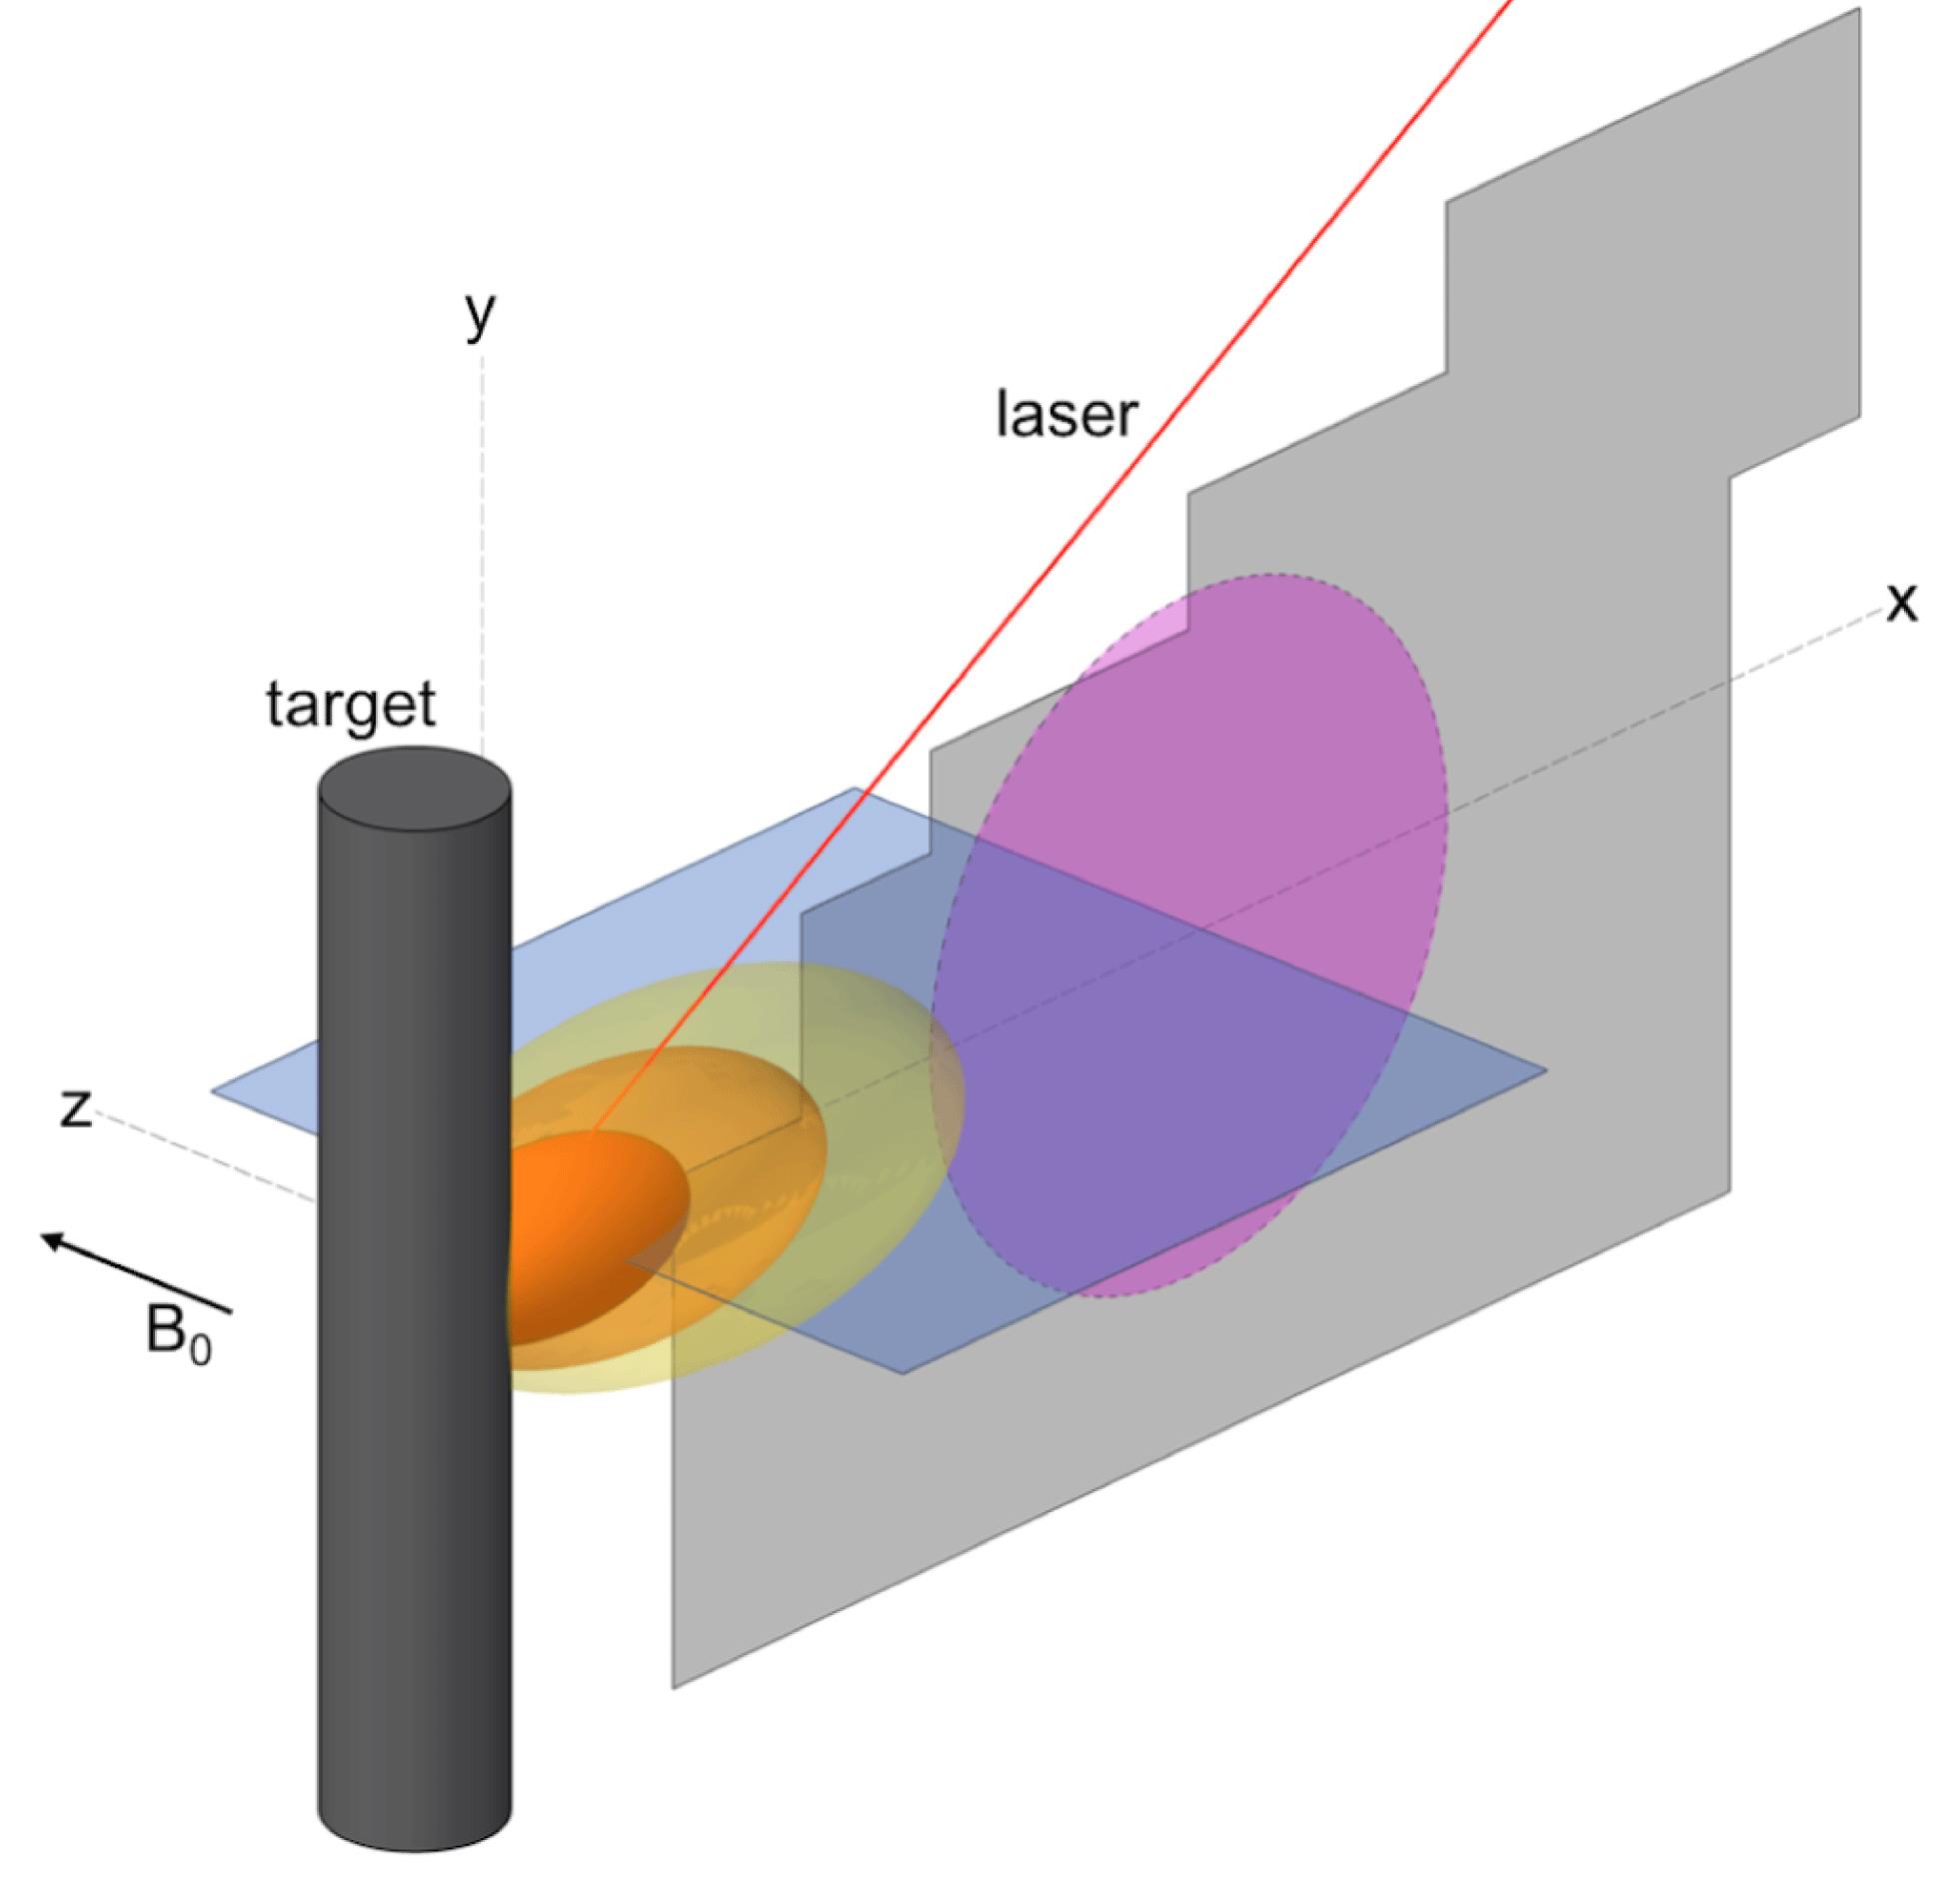
Fig. 1. Schematic of the experimental setup in the LAPD. A high-repetition-rate laser hits a plastic target embedded in an ambient magnetized plasma. The target rotates and translates in between laser shots. The resulting interaction between the laser plasma and ambient plasma is scanned with magnetic flux (‘bdot’) probes and emissive Langmuir probes in two intersecting planes,  –
– (blue) and
  –
– (gray). The location of the high-density ambient plasma at
  is shown in purple.
– (blue) and – (gray). The location of the high-density ambient plasma at is shown in purple. 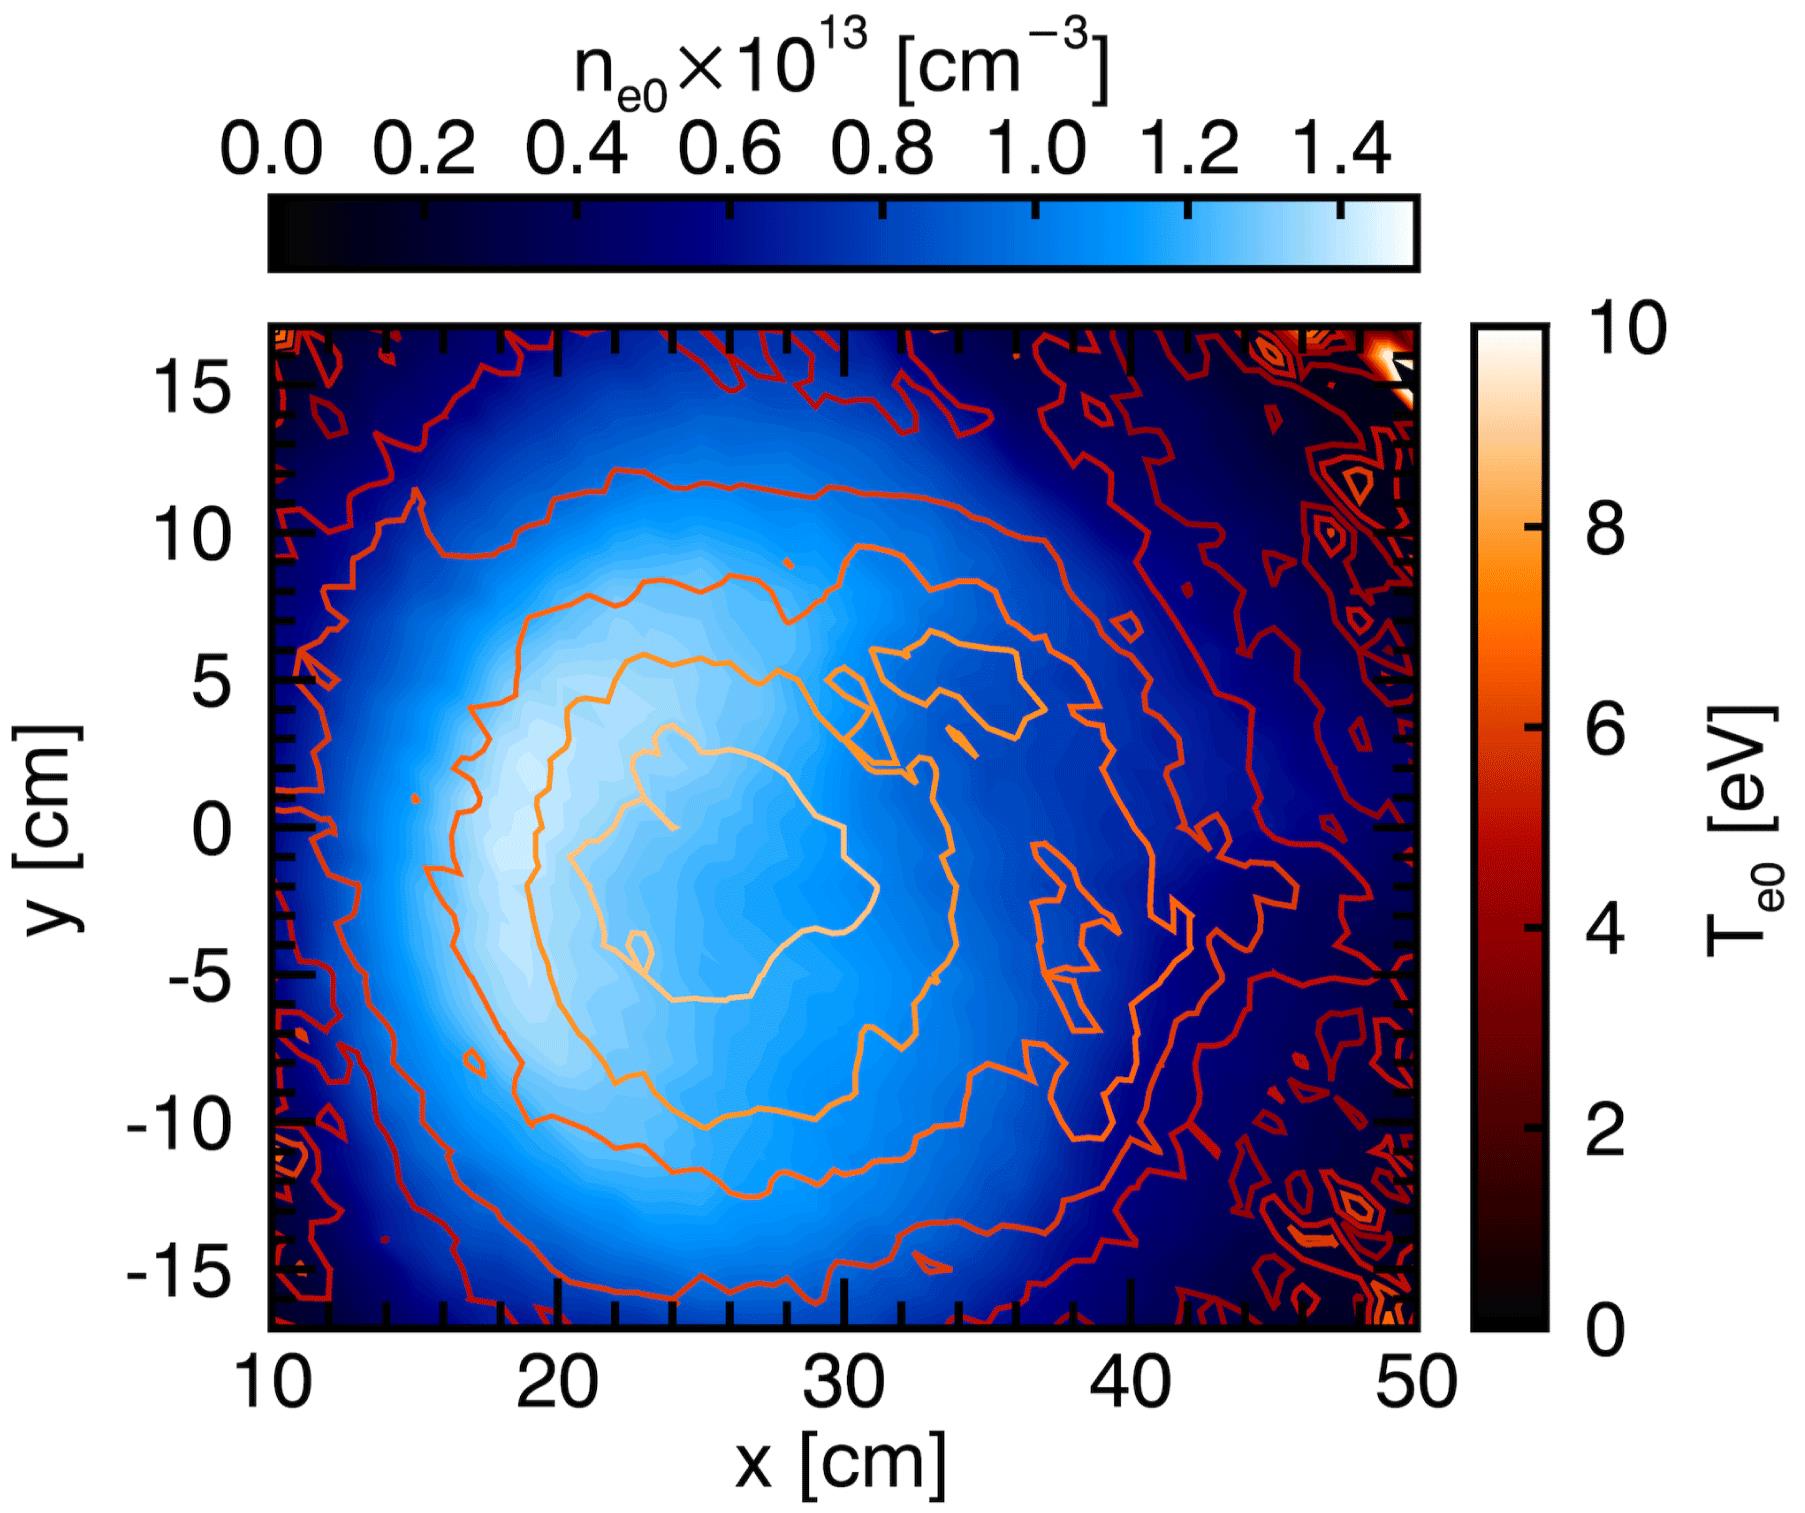
Fig. 2. Langmuir probe measurements of the initial electron density  and temperature
  in the
  –
– plane. The target is located at
  .
.
and temperature in the – plane. The target is located at . Fig. 3. Composite plots of (a) the magnitude of the relative magnetic field  and (b) the electrostatic potential
  in the
  –
– and
and  –
– planes at the same time
  . Each plane is comprised of thousands of separate laser shots, showing a high degree of reproducibility. The target is located at
  .
.
and (b) the electrostatic potential in the – and – planes at the same time . Each plane is comprised of thousands of separate laser shots, showing a high degree of reproducibility. The target is located at . Fig. 4. Time series of surface plots of  in the
  –
– plane, where the vertical dimension (color) is the magnitude of
  . The target is at
  and the background field
  along
along  .
.
in the – plane, where the vertical dimension (color) is the magnitude of . The target is at and the background field along . Fig. 5. Time series of contour plots of  in the
  –
– plane. The target is at
  .
.
in the – plane. The target is at . Fig. 6. Measured and derived quantities in the  –
– plane at time
  . (a) Measured vector magnetic field
  . (b) Vector electric field
  derived from the gradient of the measured electrostatic potential. (c)
  -component of the current density
  , derived from the measured magnetic field. (d) Charge density derived from the measured potential. (e) Profiles taken along
  in (a)–(d). Also shown in (a)–(d) is an image of plasma self-emission at the same time.
– plane at time . (a) Measured vector magnetic field . (b) Vector electric field derived from the gradient of the measured electrostatic potential. (c) -component of the current density , derived from the measured magnetic field. (d) Charge density derived from the measured potential. (e) Profiles taken along in (a)–(d). Also shown in (a)–(d) is an image of plasma self-emission at the same time. Fig. 7. Measured and derived quantities in the  –
– plane at time
  . (a)
. (a)  -component of the measured relative magnetic field
  . (b) Vector electric field
  derived from the gradient of the measured electrostatic potential. (c) Vector current density
  , derived from the measured magnetic field. (d) Charge density derived from the measured potential. (e) Profiles taken along
  in (a)–(d). Also shown in (a)–(d) is an image of plasma self-emission at the same time.
– plane at time . (a) -component of the measured relative magnetic field . (b) Vector electric field derived from the gradient of the measured electrostatic potential. (c) Vector current density , derived from the measured magnetic field. (d) Charge density derived from the measured potential. (e) Profiles taken along in (a)–(d). Also shown in (a)–(d) is an image of plasma self-emission at the same time.
|
Table 1. Typical experimental parameters. The collisional localization is taken with respect to the mean free path  between laser-ablated C ions and ambient H ions.
between laser-ablated C ions and ambient H ions. 
Set citation alerts for the article
Please enter your email address
© Copyright 2018-2021 | Chinese Laser Press. All Rights Reserved 沪ICP备15018463号-20