
Yurong Zhang, Ying Chang, Wanrong Gao. Effect of Light Polarization State on Phase Delay Measurement Induced by Tissue Birefringence in Polarization-Sensitive Optical Coherence Tomography Imaging System[J]. Acta Optica Sinica, 2019, 39(12): 1212007
- Acta Optica Sinica
- Vol. 39, Issue 12, 1212007 (2019)
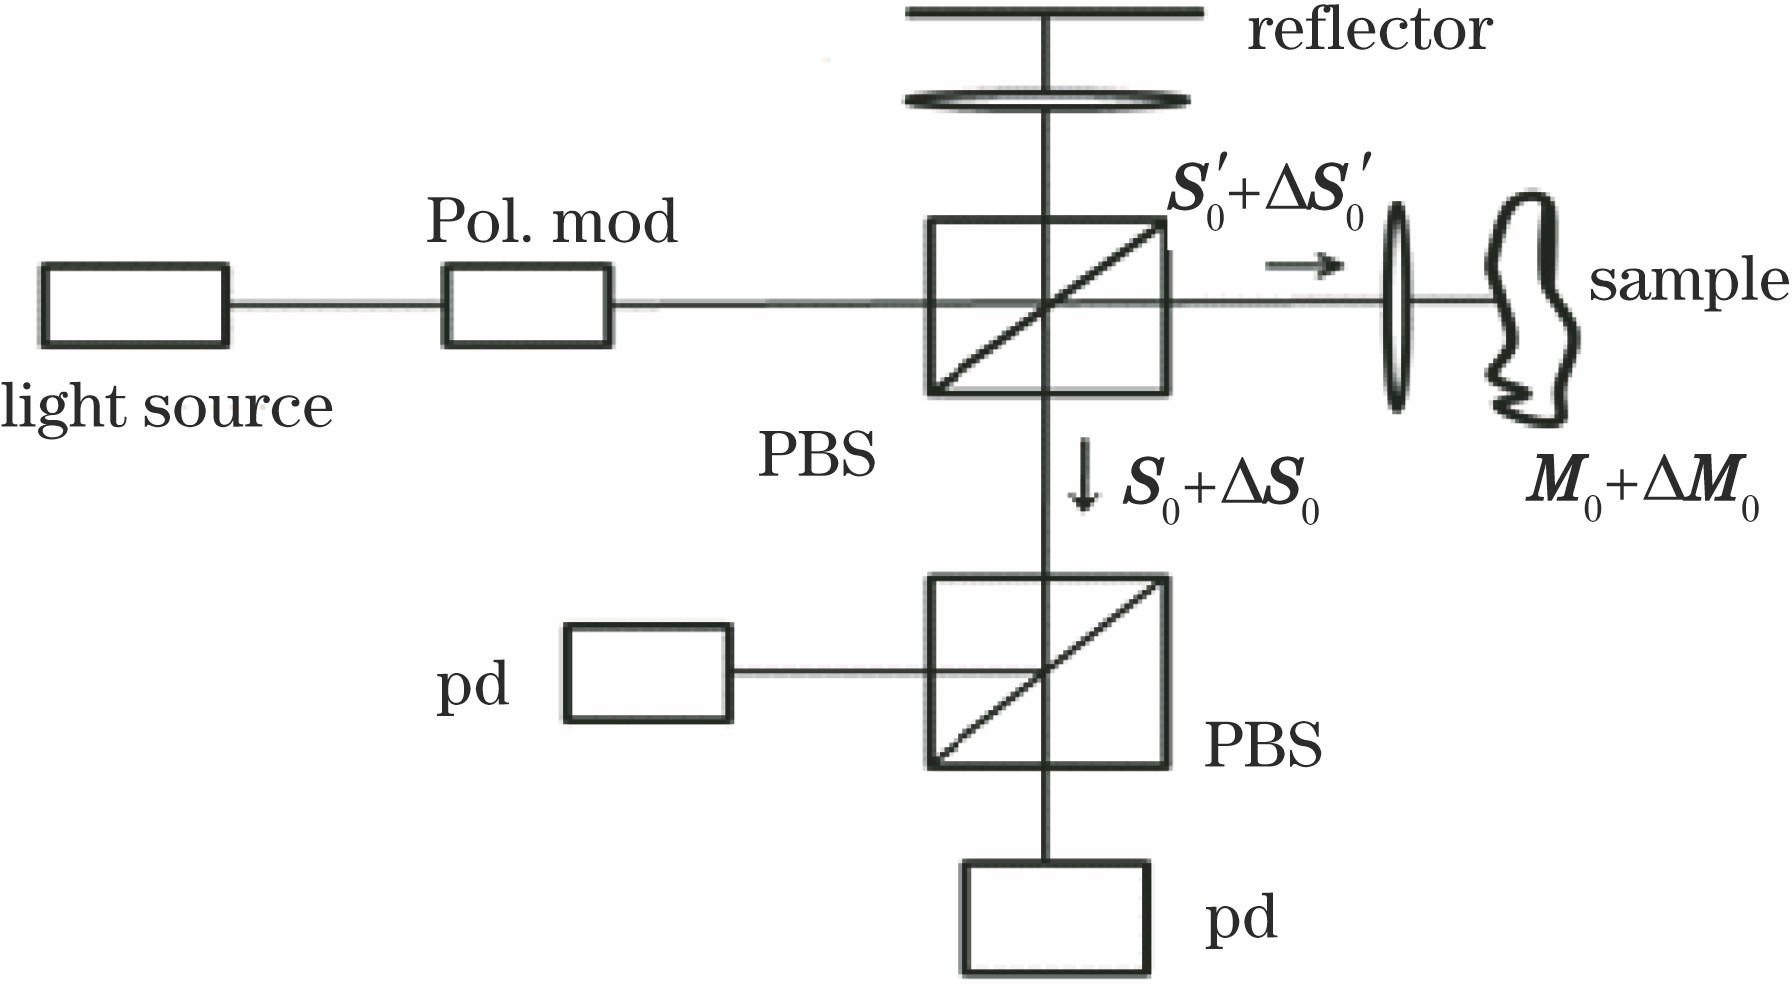
Fig. 1. Schematic of PS-OCT system
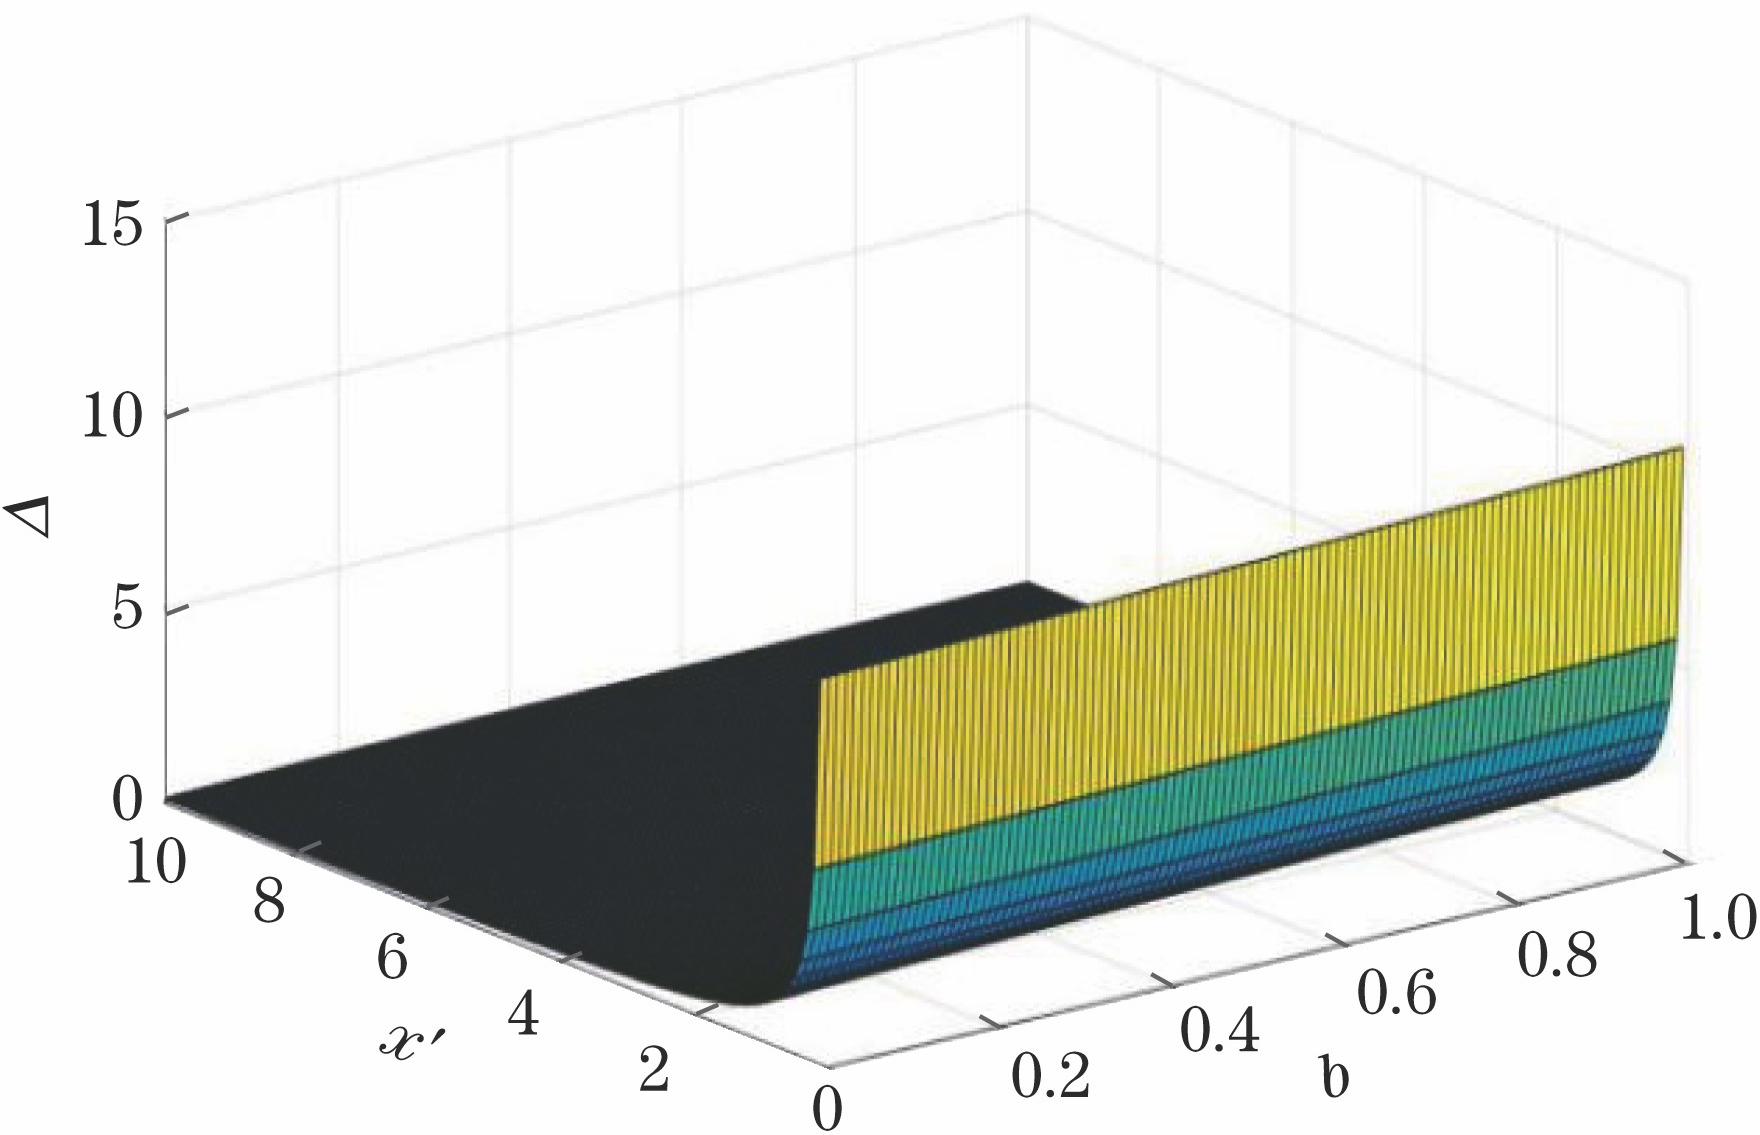
Fig. 2. Diagram of relationship among Δ,b, and x'
Fig. 3. Relationship among error, incident azimuth angle, and phase retardation of sample when θ1=0°. (a) Relationship between error and incident azimuth when incident polarization is linear polarization; (b) relationship between error and incident azimuth when incident polarization is elliptical polarization; (c) relationship between error and phase retardation when incident polarization is linear polarization; (d) relationship between error and phase retardation when incident polariz
Fig. 4. Relationship among error, incident azimuth angle, and phase retardation of sample when θ1=45°. (a) Relationship between error and incident azimuth when incident polarization is linear polarization; (b) relationship between error and incident azimuth when incident polarization is elliptical polarization; (c) relationship between error and phase retardation when incident polarization is linear polarization; (d) relationship between error and phase retardation when incident polari
Fig. 5. Relationship among error, incident azimuth angle, and phase retardation of sample when θ1=60°. (a) Relationship between error and incident azimuth when incident polarization is linear polarization; (b) relationship between error and incident azimuth when incident polarization is elliptical polarization; (c) relationship between error and phase retardation when incident polarization is linear polarization; (d) relationship between error and phase retardation when incident polari
Fig. 6. Schematic of PS-OCT imaging system
Fig. 7. Diagrams of intensity and phase retardation with 90° and 135° linearly polarized incident light. (a) Intensity with 90° linearly polarized incident light; (b) phase retardation with 90° linearly polarized incident light; (c) intensity with 135° linearly polarized incident light; (d) phase retardation with 135° linearly polarized incident light
Fig. 8. Diagrams of intensity and phase retardation with circularly and elliptically polarized incident light. (a) Intensity with circularly polarized incident light; (b) phase retardation with circularly polarized incident light; (c) intensity with 60° elliptically polarized incident light; (d) phase retardation with 60° elliptically polarized incident light

Set citation alerts for the article
Please enter your email address
© Copyright 2018-2021 | Chinese Laser Press. All Rights Reserved 沪ICP备15018463号-20