• Spectroscopy and Spectral Analysis
  • Vol. 41, Issue 2, 360 (2021)
Guo-xian ZHANG1、1、*, Ren-zhi HU1、1, Pin-hua XIE1、1, Feng-yang WANG1、1, Yi-hui WANG1、1, Jin-zhao TONG1、1, Shi-yi CHEN1、1, Shu-le LI1、1, Wan-yi QIU1、1, and Wen-qing LIU1、1
Author Affiliations
  • 1[in Chinese]
  • 11. Key Laboratory of Environmental Optics and Technology, Anhui Institute of Optics and Fine Mechanics, Chinese Academy of Sciences, Hefei 230031, China
  • show less
    DOI: 10.3964/j.issn.1000-0593(2021)02-0360-08 Cite this Article
    Guo-xian ZHANG, Ren-zhi HU, Pin-hua XIE, Feng-yang WANG, Yi-hui WANG, Jin-zhao TONG, Shi-yi CHEN, Shu-le LI, Wan-yi QIU, Wen-qing LIU. Observation and Analysis of Taizhou Atmosphere NH3 Concentration by Off-Axis Integrated Cavity Output Spectroscopy[J]. Spectroscopy and Spectral Analysis, 2021, 41(2): 360 Copy Citation Text show less
    OA-ICOS system schematic diagram
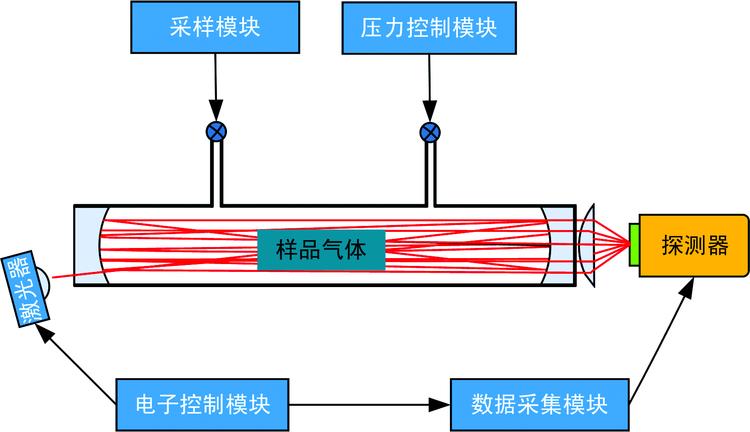
    Fig. 1. OA-ICOS system schematic diagram
    Observation site
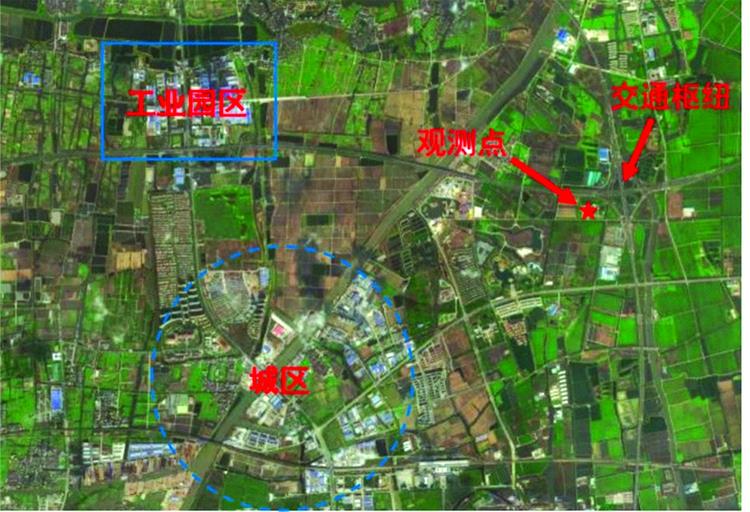
    Fig. 2. Observation site
    Change curve of NH3 desorption concentration
    Fig. 3. Change curve of NH3 desorption concentration
    (a) Total time series of pollutant concentration; (b) Time series of NH3 concentration in pollution events; (c) Wind direction wind speed rose illustration
    Fig. 4. (a) Total time series of pollutant concentration; (b) Time series of NH3 concentration in pollution events; (c) Wind direction wind speed rose illustration
    Daily variation of pollutant concentration
    Fig. 5. Daily variation of pollutant concentration
    (a) Diurnal relationship between NH3 concentration and ambient temperature; (b) Relationship between NH3 concentration and temperature and humidity in the morning of June 12
    Fig. 6. (a) Diurnal relationship between NH3 concentration and ambient temperature; (b) Relationship between NH3 concentration and temperature and humidity in the morning of June 12
    Morning trends of NH3, NOx and CO on June 6, 7, 8, 9, and 14
    Fig. 7. Morning trends of NH3, NOx and CO on June 6, 7, 8, 9, and 14
    (a) The correlation of NH3vs NOx during morning peak on June 7; (b) The correlation of NH3vs CO during morning peak on June 7
    Fig. 8. (a) The correlation of NH3vs NOx during morning peak on June 7; (b) The correlation of NH3vs CO during morning peak on June 7
    Analysis results of backward trajectory during observation
    Fig. 9. Analysis results of backward trajectory during observation
    种类NH3/
    (μg·m-3)
    NOx/
    (μg·m-3)
    CO/
    (μg·m-3)
    O3/
    (μg·m-3)
    Temp/
    RH/
    %
    范围13.9~280.50.1~126.0129.2~1 640.61.2~328.118.7~35.026.0~96.0
    平均值25.1±4.519.5±9.6521.2±206.7111.6±40.925.5±3.067.1±13.1
    白天均值24.7±4.914.6±5.9499.1±185.6156.1±51.328.0±3.856.5±15.7
    夜间均值25.6±4.125.3±13.8547.4±231.659.1±28.622.6±2.079.7±9.9
    Table 1. Statistics of gaseous pollutant concentration and meteorological parameters
    地点时间种类浓度均值/
    (μg·m-3)
    参考
    文献
    广州, 广东2004.10乡村7.3[2]
    西安, 陕西2006.7城市28.4[18]
    北京2006.8—2008.10乡村9.5[19]
    邯郸, 河北2006.8—2008.10乡村14.5[19]
    青岛, 山东2012.5郊区3.0[13]
    青岛, 山东2015.12城市2.2[12]
    多伦多, 加拿大2007.8高速公路3.0±1.8[11]
    巴塞罗那, 西班牙2010.7城市干道7.6[20]
    巴塞罗那, 西班牙2011.1城市3.9[20]
    新德里, 印度2013.1—2015.12城市40.5±11.3[21]
    泰州, 江苏2018乡村25.1±4.5本研究
    Table 2. Comparison of the concentration of NH3 in different parts of the world
    气团比例/%O3/(μg·m-3)NOx/(μg·m-3)CO/(μg·m-3)NH3/(μg·m-3)
    113.43105.623.4643.329.2
    258.33120.120.5569.924.8
    318.5297.214.2301.425.4
    49.7285.019.4467.166.7
    Table 3. Different air flow paths and the corresponding concentrations of O3, NOx, NH3 and CO
    Guo-xian ZHANG, Ren-zhi HU, Pin-hua XIE, Feng-yang WANG, Yi-hui WANG, Jin-zhao TONG, Shi-yi CHEN, Shu-le LI, Wan-yi QIU, Wen-qing LIU. Observation and Analysis of Taizhou Atmosphere NH3 Concentration by Off-Axis Integrated Cavity Output Spectroscopy[J]. Spectroscopy and Spectral Analysis, 2021, 41(2): 360
    Download Citation