• Journal of Geographical Sciences
  • Vol. 30, Issue 6, 1005 (2020)
Erfu DAI1、2 and Yahui WANG、*
Author Affiliations
  • 1. Lhasa Plateau Ecosystem Research Station, Key Laboratory of Ecosystem Network Observation and Modeling, Institute of Geographic Sciences and Natural Resources Research, CAS, Beijing 100101, China
  • 2. University of Chinese Academy of Sciences, Beijing 100049, China
  • show less
    DOI: 10.1007/s11442-020-1767-y Cite this Article
    Erfu DAI, Yahui WANG. Attribution analysis for water yield service based on the geographical detector method: A case study of the Hengduan Mountain region[J]. Journal of Geographical Sciences, 2020, 30(6): 1005 Copy Citation Text show less

    Abstract

    Ecosystem services, which include water yield services, have been incorporated into decision processes of regional land use planning and sustainable development. Spatial pattern characteristics and identification of factors that influence water yield are the basis for decision making. However, there are limited studies on the driving mechanisms that affect the spatial heterogeneity of ecosystem services. In this study, we used the Hengduan Mountain region in southwest China, with obvious spatial heterogeneity, as the research site. The water yield module in the InVEST software was used to simulate the spatial distribution of water yield. Also, quantitative attribution analysis was conducted for various geomorphological and climatic zones in the Hengduan Mountain region by using the geographical detector method. Influencing factors, such as climate, topography, soil, vegetation type, and land use type and pattern, were taken into consideration for this analysis. Four key findings were obtained. First, water yield spatial heterogeneity is influenced most by climate-related factors, where precipitation and evapotranspiration are the dominant factors. Second, the relative importance of each impact factor to the water yield heterogeneity differs significantly by geomorphological and climatic zones. In flat areas, the influence of evapotranspiration is higher than that of precipitation. As relief increases, the importance of precipitation increases and eventually, it becomes the most influential factor. Evapotranspiration is the most influential factor in a plateau climate zone, while in the mid-subtropical zone, precipitation is the main controlling factor. Third, land use type is also an important driving force in flat areas. Thus, more attention should be paid to urbanization and land use planning, which involves land use changes, to mitigate the impact on water yield spatial pattern. The fourth finding was that a risk detector showed that Primarosol and Anthropogenic soil areas, shrub areas, and areas with slope <5° and 25°-35° should be recognized as water yield important zones, while the corresponding elevation values are different among different geomorphological and climatic zones. Therefore, the spatial heterogeneity and influencing factors in different zones should be fully considered while planning the maintenance and protection of water yield services in the Hengduan Mountain region.

    1 Introduction

    Ecosystem services are the important resources provided by the natural systems to humans. These services serve as environmental foundations for human survival and development (Daily, 1997; Fu et al., 2009). The research on the connotation, generation mechanism, and expression of ecosystem services has received increasing attention in recent years (MA, 2005; TEEB, 2013; Díaz et al., 2015); and has become the new frontier for research in center of ecology and related disciplines (Fu et al., 2009; Li et al., 2009). Water yield is of the ecosystem services—significant for maintaining the stability of the ecosystem and improving human well-being. On the one hand, water yield service directly affects human well- being by providing sufficient water, entertainment, and aesthetic values (Sánchez-Canales et al., 2012); On the other hand, changes in the hydrological cycle indirectly affect human welfare by affecting the carbon cycle, vegetation growth, and ecosystem services trade-offs (Ahmed et al., 2017). For example, increases in water yield can promote the performance of soil conservation and carbon storage within a certain threshold (Jiang et al., 2018; Qian et al., 2018). The Hengduan Mountain region in Southwest China lies in the upstream area of many domestic and international rivers, such as the Nujiang, Lancang, and Jinsha rivers. The large river channel drop, caused by complex topography makes this area a primary source of freshwater and hydropower in China (Lin and Wu, 2015). The water yield service supports the residents living in the Hengduan Mountain region and the surrounding areas because of the spillover effect (Liu et al., 2015).

    Ecosystem service concepts, values, and trade-offs are increasingly being applied to regional land use planning and decision-making (Goldstein et al., 2012; Bateman et al., 2013; Guerry et al., 2015; Hu et al., 2018). The identification of spatial heterogeneity characteristics and driving forces of ecosystem services are the basis for decision-making. Current research on the spatial heterogeneity of ecosystem services has mainly focused on two aspects. One is the characterization of the degree of heterogeneity, such as taking the coefficient of variation and the Taylor index to examine the spatial differences (Liu et al., 2018) or detecting the spatial differences of ecosystem services along various gradients through the introduction of natural or man-made ecological gradients (Larondelle and Haase, 2013). The other is the determination of the driving factors of ecosystem services at different spatial locations using regression models. For example, Ahmed et al. (2017) and Hou et al. (2018) analyzed the relationship between water yield and net primary production (NPP) services with diverse factors using a geographically weighted regression method. Although many related studies have been carried out, the research still lacks on the contribution of single factors and the interactions between different factors on ecosystem service spatial heterogeneity. The geographical detector method (Wang and Xu, 2017) is a set of statistical methods that can explain the main driving force underlying the spatial heterogeneity of the elements, and simultaneously detect the explanatory power of the combination of two factors on an element. This method is applied to detect both numerical and qualitative data and is widely used in the fields of human health (Tao et al., 2016), socioeconomics (Wang et al., 2016), environmental science (Lou et al., 2016), and ecological landscapes (Liang and Yang, 2016).

    Landscape heterogeneity would directly affect species dynamics, community structure, and other ecological processes in the ecosystem. It also ultimately affects the expression of multiple ecosystem services (Turner et al., 2013). In the Hengduan Mountain region, the landscape heterogeneity is more complicated. With the increase in elevation, the non-synchronous changes in meteorological elements such as temperature and precipitation cause vertical differences in the landscape, and this vertical heterogeneity also changes depending on the longitude and latitude in the horizontal direction. As a result, the water yield service in the Hengduan Mountain region presents both horizontal and vertical heterogeneity, and human activities such as urbanization and resource exploitation further enhance this spatial heterogeneity. Current research on water yield service in and around the Hengduan Mountain region focuses more on the evaluation and mapping (Chen et al., 2011; Lin and Wu, 2015; Wang et al., 2017), but does not sufficiently address spatial heterogeneity and its attribution analysis. Although the application of various models has proven that water yield service is the result of a combination of different factors related to climate, topography, and land use, it is not yet clear which individual factor or combination of factors is the main controlling element for water yield spatial heterogeneity. The diverse and complex geomorphic and climatic types and the various combinations of the two factors in the zone make the water yield spatial heterogeneity more obvious in the Hengduan Mountain region. In this study, we selected influencing factors such as climate, topography, soil, vegetation, and types of land use based on the geomorphological and climatic zones to explore the characteristics of water yield spatial heterogeneity and its attribution by using the geographical detector method. This work provides scientific information for the rational allocation of water resources and the maintenance of ecological security in mountain regions. The research is conducive to the refined management of subregions that are parts of large-scale regions.

    2 Materials and methods

    2.1 Study area

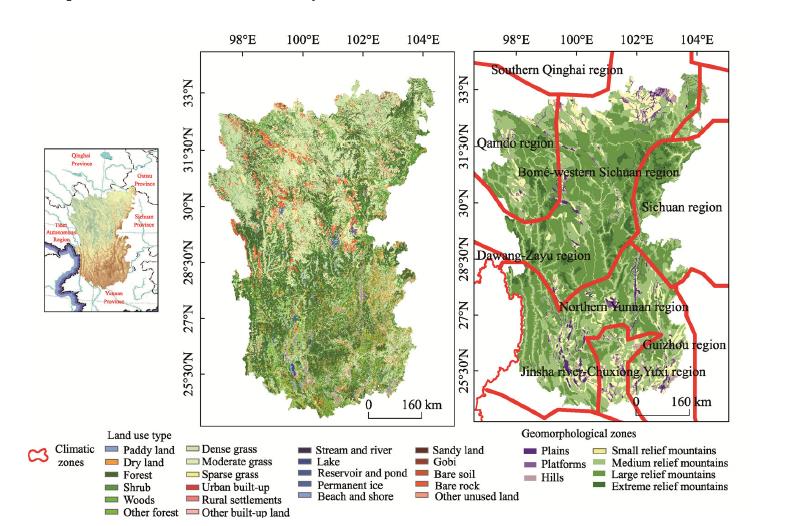
    The Hengduan Mountain region (24°39′N-33°34′N, 96°58′E-104°27′E) is located in Southwest China and has a total area of 449,748 km2 that mainly includes the eastern part of the Tibet Autonomous Region, western Sichuan Province, and northwestern Yunnan Province. The elevation ranges from 306 to 7143 m and tends to increase from southeast to northwest. This region also contains various geomorphological zones because of the complex terrain (Figure 1). The study area is an upstream area of the major rivers in China and Southeast Asia, with developed river systems and numerous tributaries. The climatic zoning of this region includes mainly the Qamdo and Bomê-western Sichuan regions belonging to the plateau climate zone, and the Sichuan, northern Yunnan, Jinsha river-Chuxiong, Yuxi regions that belong to the mid-subtropical climate zone (Figure 1). The vegetation also presents an obvious vertical heterogeneity due to the distinct differences in climatic conditions, which vary from the arid valley shrubs at low elevations to the sparse alpine vegetation found at high elevations (Zhang et al., 1997). Additionally, the vertical zonation of the vegetation varies based on the horizontal zone. The soil types cover four major soil series: red, brown, cinnamon, and alpine soil. The spatial differentiation of vegetation and soil and the various combinations of the two result in changes in the water yield service across the study space by affecting evapotranspiration and other water cycle processes, finally leading to the spatial differentiation of water yield.

    Location, land use type, geomorphology, and climate division of the Hengduan Mountain region

    Figure 1.Location, land use type, geomorphology, and climate division of the Hengduan Mountain region

    2.2 Data source and processing

    According to the water yield model in the InVEST software and geographical detector method, the data required in this study mainly included climate data, a digital elevation model (DEM), soil data, land use data, a normalized difference vegetation index (NDVI), hydrological data, geomorphological, and climatic types data. Climatic data such as daily temperature, precipitation, and wind speed of the 42 meteorological stations—located in and around the Hengduan Mountain region, were obtained from the National Meteorological Information Center of China (http://data.cma.cn/); Raster-formatted meteorological data were obtained via Anusplin interpolation method; DEM (mainly used for the extraction of watersheds and sub-watersheds), geomorphological and climatic types data from the resource and environment data cloud platform (http://www.resdc.cn/). Soil data included soil type, depth, texture, and organic matter content. The land use data used in this study was obtained viainterpretation of 30 m resolution remote sensing images. We divided the land use types into 22 categories (Figure 1) as per the classification system of Liu et al. (2010) with an accuracy of 91.04%, to meet the requirements of our study. Moderate Resolution Imaging Spectroradiometer (MODIS) NDVI data (MOD13A3: 1 km resolution monthly data) was obtained from the Land Processes Distributed Active Archive Center (https://lpdaac. usgs.gov/). Based on the land geomorphology of Zhou et al. (2009), we merged the types according to the relief degree of land surface and formed seven types of terrains namely, plains, platforms, hills, small relief mountains, medium relief mountains, large relief mountains, and extreme relief mountains (Figure 1). The runoff data during 2006-2015 for the 18 hydrological stations were obtained from the hydrologic data yearbook of the People’s Republic of China and used for the verification of the model-simulated results.

    2.3 Methods

    2.3.1 Framework

    The present study focused on the spatial heterogeneity of water yield service in the Hengduan Mountain region and investigated the driving factors underlying this heterogeneity. Based on the above objectives, we constructed the following research framework (Figure 2): (1) Based on the water yield model in the InVEST software, we evaluated the water yield service and validated the results. (2) The spatial differences in the degree of relief and the climate are the basis for the heterogeneity of various ecological and environmental elements in mountain areas. We explored the main influencing factors for the spatial heterogeneity of water yield in different geomorphological and climatic zones by using the geographical detector method. (3) We identified the contribution of single factors to the water yield heterogeneity with a ‘factor detector’ and an ‘ecological detector’, determined the effects of the interactions of different factors with an ‘interaction detector’, and identified the areas of high value water yield service with a ‘risk detector’ .

    Framework for the spatial heterogeneity and driving mechanism of water yield service

    Figure 2.Framework for the spatial heterogeneity and driving mechanism of water yield service

    2.3.2 Water yield service assessment and mapping

    The water yield module in the InVEST software is based on the Budyko curve (Budyko, 1974):

    where Yxj and AETxj are the average water yield and annual actual evapotranspiration on the pixel x for the land use typej, respectively, Px is the precipitation on the pixelx. AETxj/Px is the ratio of the actual evapotranspiration and precipitation which is based on the development of Budyko curve by Zhang et al. (2001):

    where Rxj represents the Budyko dryness for the pixel x and land use type j; ${\omega _x}$ is the ratio of plant accessible water storage and the expected precipitation; Z is Zhang coefficient (Zhang et al., 2001); kij is vegetation evapotranspiration coefficient; $PAW{C_x}$ is plant available water content (Zhou et al., 2005).

    2.3.3 Identifying influencing factors for the spatial heterogeneity of water yield

    The geographical detector method is a set of statistical methods that detect the relationship between an event and potential risk factors (Wang and Xu, 2017). If the spatial distributions of the independent variable and the dependent variable are similar, then the independent variable has an important influence on the dependent variable (Wang et al., 2010; Wang and Hu, 2012). Greater levels of similarity imply a greater influence. In this study, we set the water yield service as the dependent variable and identified the main factors for its heterogeneity by using the geographical detector method in different geomorphological and climatic zones. In terms of influencing factors, this study focused on both natural and human activities. The natural factors involve climate, topography, soil, and vegetation, and human activity factors mainly refer to those related to land use. Finally, 15 factors were selected as independent variables (Table 1). In addition to the land use type, the factors related to the composition and structure of land use had been considered as land-use factors expressed by landscape metrics. Specifically, at the landscape level, Shannon’s diversity index (SHDI), Contagion Index (CONTAG), and Effective mesh size (MESH) were selected to represent the diversity, concentration, and fragmentation, respectively. Class level metrics of the Percentage of Landscape (PLAND) for cultivated land, forests, and grassland were used to present the land use constitution. All the metrics were calculated by the ‘moving window’ function in the landscape pattern analysis model Fragstats (Mcgarigal and Marks, 1995). A total of 16,925 points were generated at 5 km intervals for the spatial correlation of multiple factors.

    CategoryIndicatorsData typeCategoryIndicatorsData type
    ClimateAnnual average temperatureContinuousLand useLand use typesDiscrete
    PrecipitationContinuousSHDIContinuous
    Solar radiationContinuousCONTAGContinuous
    Actual evapotranspirationContinuousMESHContinuous
    TopographyElevationContinuousPLAND (cultivated land)Continuous
    SlopeContinuousPLAND (forests)Continuous
    SoilSoil typeDiscretePLAND (grassland)Continuous
    VegetationNDVIContinuous

    Table 1.

    Driving factors for water yield spatial heterogeneity in the Hengduan Mountain region

    In general, the geographical detector contains four formulas: the factor detector, the interaction detector, the risk detector, and the ecological detector. The factor detector is used to detect the spatial differentiation of water yield service and to determine the proportion of the spatial distribution of water yield that can be explained by different factors. It is obtained by comparing the sum of the variance of the subareas in a region and the variance of the total region, which can be measured by the q value (Wang et al., 2010):

    where h indicates the stratified status of water yield or climate, topography, soil, vegetation, land use, and other factors, and there were a total of L strata. The input data required in geographical detector must be categorical data, therefore, we divided the continuous data into strata data. With reference to the data discretization method and the study experience proposed by Wang and Xu (2017), the slope data was divided into 6 levels (≤5°, 5°-8°, 8°-15°, 15°-25°, 25°-35°, >35°), NDVI was divided into 7 levels according to the natural breaks, and the other factors were divided into 9 levels with the same method. All the influencing factors used unitive discretization standards across different geomorphological and climatic zones. SSW andSST represent the sum of the variance of the subareas and the variance of the total region, respectively. N is the number of units in the whole region, and Nh is the number of units inh stratum; $\sigma _h^2$ is the variances of water yield in theh-stratum, and ${\sigma ^2}$ is the variances in the whole region. The q value indicates that influencing factors could explain 100×q% of the spatial distribution of water yield. A larger value means a stronger explanatory power whose significance can be detected by the geographical detector software (Wang and Xu, 2017).The ecological detector is used to determine if there is a significant difference in the contribution of different influencing factors to the water yield spatial heterogeneity. The F statistic was usually used to detect when the q values of two factors were not significantly different:

    In the risk detector, the t test was used to explore significant differences in water yield across different strata:

    where ${\overline Y _h}$ indicates the mean value in the h stratum, and Var represents variance.The contribution of the interaction of two influencing factors to water yield can be calculated using the interaction detector module. If q (X1∩X2) < Min (q(X1), q(X2)), the interaction presents nonlinear weakening; if Min (q(X1), q(X2)) < q(X1∩X2) < Max(q(X1),q(X2)), the interaction is single factor nonlinear weakening; if q(X1∩X2) > Max(q(X1),q(X2)), the interaction is two factors enhancement; if q (X1∩X2)=q(X1) + q(X2), the two factors are independent; if q(X1∩X2) >q(X1) + q(X2), the relationship is nonlinear enhancement.

    3 Results

    3.1 Spatial distribution of water yield

    The water yield depth of the Hengduan Mountain region ranged from 0 to 1619 mm in the year 2010, and the average depth of the water yield of the whole region was 420 mm. Based on the DEM data, we rebuilt the corresponding sub-watersheds by taking the hydrological stations as watershed outlets through ArcHydro. Further, we compared the observation runoff data with the simulated data of each sub-watershed for verification, and the results showed that there was a high correlation (the coefficient reaches as high as 0.9947). This indicates that the simulated results can be used to analyze the spatial heterogeneity of water yield service—in which spatial differences exist. The high water yield value areas were mainly concentrated in the Three Parallel Rivers Region (TPRR) in the western part of the Hengduan Mountain region and in areas of Yuexi, Meigu, and Zhaojue counties located at the southwest edge of Sichuan Basin. The Chaya, Gongjue, and Mangkang county areas lying in the northwestern part belong to the areas of low water yield value (Figure 3).

    Spatial pattern of water yield service in the Hengduan Mountain region

    Figure 3.Spatial pattern of water yield service in the Hengduan Mountain region

    3.2 Identifying dominant factors for water yield service

    For the Hengduan Mountain region, precipitation (58.9%) and actual evapotranspiration (26.7%) had the strongest explanatory power for water yield, which were significantly higher than those of other factors. The ecological detector showed that the effects of precipitation and actual evapotranspiration on water yield were significantly different (Figure 4). For factors with q value between 10% and 15%, the explanatory degree decreases in following order: land use type (14.7%), solar radiation (14.5%), elevation (12.6%), and soil type (11.08%). Significant differences existed in the effects of most pairwise factors on water yield except for land use type with solar radiation and elevation with soil type. Among the factors with an explanatory degree of less than 10%, NDVI and annual mean temperature had higher explanatory degree, and there were no significant differences between the two. We classified the factors and found that the q values of climatic factors were the highest and that significant differences existed among these factors. For land use related factors, the contribution of land use type to water yield was much higher than the contribution of vegetation growth (NDVI), land use composition, or structure. In terms of topography related factors, elevation seemed to be a controlling factor.

    Influence of different driving factors on spatial heterogeneity of water yield in different climatic and geomorphological zones

    Figure 4.Influence of different driving factors on spatial heterogeneity of water yield in different climatic and geomorphological zones

    Differences existed in the type and explanatory degree of factors that affect the spatial distribution of water yield in different geomorphological zones (Figure 4). For example, the explanatory degree of elevation was not significant in platforms, but was 26.1% in hilly areas; the explanatory degree of land use types was only 11.9% in medium relief mountains but was as high as 53.3% in the platform areas. Similar to the results in the whole region, climate-related factors generally had the strongest explanatory degree. Precipitation and actual evapotranspiration contributed the most, and the temperature factor can be ignored. Of the land use related factors, the contribution of land use composition and structure was limited to less than 10% for each factor. In flat terrains such as plains and platform areas, the actual evapotranspiration and land use type were the controlling factors for the distribution of water yield and had a significant difference with other factors. This is likely because the precipitation is relatively uniform on such a small scale causing the actual evapotranspiration and vegetation types to become the principal factors. With an increase in the degree of relief of the land surface, actual evapotranspiration became the controlling factor in hilly areas, and the interpretation power of precipitation has improved and significantly higher than other factors. With the continuous increase of land relief, the contribution of precipitation gradually increased compared to the other factors. In the small to extreme relief mountains, the q values of precipitation exceeded those of actual evapotranspiration to be the first or second controlling factors, and was significantly higher than other environmental factors; the explanatory degree of land use type—one of the controlling factors in the flat areas, was significantly reduced in high-relief areas.The controlling factors for water yield varied across the climatic zones in the Hengduan Mountain region; however, precipitation, actual evapotranspiration, and land use type were still the main influencing factors (Figure 4). In the Qamdo and Bomê-western Sichuan regions in the plateau climate zone, actual evapotranspiration was the factor with the strongest explanatory degree and had a significantly higher impact than land use type or precipitation. This area belongs to the semi-humid region with relative low and uniform precipitation. Regional evapotranspiration had, therefore, become an important factor, and physiological characteristics such as vegetation type and root depth indirectly affected the distribution of water yield by changing the evapotranspiration coefficient. Although all the regions belong to the mid-subtropical climate, the controlling factor types and explanatory degrees varied. In the northern Yunnan region, precipitation is abundant and has obvious spatial heterogeneity. Specifically, the Three Parallel Rivers Region in the western part of the Hengduan Mountain region is the area with the highest precipitation value. The amount of precipitation decreases in the eastward direction ranging from 600 to 1800 mm. Such strong spatial heterogeneity caused precipitation to become the main controlling factor with an explanatory degree of 62%. This value was significantly higher than the explanatory degree of actual evapotranspiration and solar radiation (27%). The interpretation of soil type was limited to only 13%, and the effects of land use type can be ignored. The most influential factor for the spatial heterogeneity of water yield was actual evapotranspiration in the Sichuan region and the Jinsha river-Chuxiong, Yuxi region. The results in these regions were very different from those found in the northern Yunnan region, and land use type plays an important role. This is mainly because the homogenization of precipitation in such a small-scale region causes the actual evapotranspiration to become the dominant factor for the water yield distribution. In the plateau climate zone, actual evapotranspiration and land use types were the dominant factors that explain spatial heterogeneity. In the mid-subtropical climate zone, precipitation was relatively abundant, and its explanatory degree was significantly higher than that of the actual evapotranspiration.

    3.3 Effects of the interaction of the factors on water yield service

    The above content analyzed the influencing degree of a single factor on the water yield spatial distribution. However, in actual, it is the complex interaction of multiple factors determines the spatial pattern. The interaction detector for the paired factors proved that the influence of the interaction of the factors on the water yield spatial distribution was much higher than that of a single factor in either the entire Hengduan Mountain region or the geomorphological and climatic zones, which presented as two factors enhancement and nonlinear enhancement (Table 2). At the mountain scale and in each sub-region, the interactions among climate factors had the strongest explanatory degree, followed by the interaction between climate factors and land use related factors. The q value for the interaction between precipitation and actual evapotranspiration was the highest and explains 97% of the water yield spatial heterogeneity. This indicates that within the same precipitation (actual evapotranspiration) stratum, the spatial difference in actual evapotranspiration (precipitation) would significantly enhance the spatial heterogeneity of water yield even if the precipitation (actual evapotranspiration) were spatially similar. The second and third most important interactions were different in each of the subregions but involved the interaction of precipitation or actual evapotranspiration with other factors. In different geomorphological zones, the combination of precipitation and land use type had a great impact on the water yield, and the explanatory degree reached a high of 70%-90%. For the plateau climatic regions (Qamdo and Bomê-western Sichuan regions), the interaction of actual evapotranspiration with other factors was the major contributor (with a q value of 60%-70%) of which the interaction between actual evapotranspiration and solar radiation was most significant. In the mid-subtropical climate zone, the interaction between actual evapotranspiration and land use type had the highest explanatory degree in the Sichuan region, and the Jinsha river- Chuxiong, Yuxi region. In the northern Yunnan region, the interaction between precipitation and land use type contributed a significant amount, second only to the contribution of the interaction between precipitation and actual evapotranspiration.

    RegionsDominant interactions
    Entire mountain regionPrecipitation∩actual evapotranspiration, precipitation∩land use type, precipitation∩soil type
    PlainsPrecipitation∩actual evapotranspiration, precipitation∩land use type, actual evapotranspiration∩soil type/elevation
    PlatformsPrecipitation∩actual evapotranspiration, precipitation∩land use type, actual evapotranspiration∩MESH metric
    HillsPrecipitation∩actual evapotranspiration, actual evapotranspiration∩elevation, precipitation∩land use type
    Small relief mountainsPrecipitation∩actual evapotranspiration, precipitation∩land use type, precipitation∩soil type
    Medium relief mountainsPrecipitation∩actual evapotranspiration, precipitation∩land use type, precipitation∩soil type
    Large relief mountainsPrecipitation∩actual evapotranspiration, precipitation∩land use type, precipitation∩soil type
    Extreme relief mountainsPrecipitation∩actual evapotranspiration, precipitation∩land use type, precipitation∩PLAND(grassland)
    Qamdo regionPrecipitation∩actual evapotranspiration, actual evapotranspiration∩other factors
    Bomê-western Sichuan regionPrecipitation∩actual evapotranspiration, precipitation∩land use type, actual evapotranspiration∩other factors
    Sichuan regionPrecipitation∩actual evapotranspiration, actual evapotranspiration∩land use type
    Jinsha river-Chuxiong, Yuxi regionPrecipitation∩actual evapotranspiration, actual evapotranspiration∩land use type
    Northern Yunnan regionPrecipitation∩actual evapotranspiration, precipitation∩land use type, precipitation∩soil type

    Table 2.

    The dominant interactions between two driving factors in different climatic and geomorphological zones in the Hengduan Mountain region

    3.4 Identification of important areas for water yield service

    Complex linear or nonlinear relationships exist between water yield and various influencing factors. A risk detector module helps to identify the water yield service level in each stratum for various factors and determine if the differences in water yield among the strata of each influencing factor are significant (with a confidence level of 95%), and to identify the areas with high water yield value by analyzing the relationship of water yield with each factor. We did not consider the factors related to land use composition and structure, which belonged to the land use category of influencing factors, into the running of risk detector, because the previous results of the factor and ecological detectors showed that their contribution to the water yield is limited. Areas with high water yield value varied significantly among different geomorphological and climatic zones in the Hengduan Mountain region (Table 3). The relationship between precipitation and water yield presented similar trends of increasing precipitation with increased water yield depth in the entire Hengduan Mountain region and different geomorphological and climatic zones. The water yield changed monotonically with the change in actual evapotranspiration, which indicated that the increase in actual evapotranspiration would reduce the water yield service to a certain extent in both the entire mountain region and the various sub-regions. It seems that the effect of temperature on the spatial heterogeneity of water yield service was more complicated when compared with other climate related factors. In all subregions except for the Sichuan climatic region, water yield showed an increasing trend as the NDVI value increased, which was probably a result of the dense vegetation that was able to intercept more precipitation. In terms of soil type factor, the high values of water yield service were mainly located in the Primarosol and Anthropogenic soil areas. Compared with other land use types, the water yield in construction land was the largest, but it is worth noting that the water yield generated in this area eventually flows into urban drainage pipes and is, consequently, difficult to access. In terms of vegetation area, shrubland had a high water yield value. In the vertical direction, except for the platforms, hills, and the northern Yunnan climatic zone, the water yield gradually decreased with increasing elevation. The decrease may be attributed to the vertical heterogeneity of land use types. The impact of slope on the spatial heterogeneity of water yield was more complicated and inconsistent and might be the result of specific environmental influences in different sub-regions.

    RegionsElevation (m)Slope (°)Soil typeNDVILand use type
    Entire mountain region1591-248425-35Primarosol0.78-0.94Shrub
    Plains2069-24840.72-0.78Shrub
    Platforms2069-2484Primarosol0.78-0.94Shrub
    Hills3377-3797Primarosol0.78-0.94Woods, shrub
    Small relief mountains2069-248425-35Primarosol0.78-0.94Shrub
    Medium relief mountains2069-248425-35Primarosol0.78-0.94Shrub
    Large relief mountains2069-2484Primarosol0.78-0.94Shrub
    Extreme relief mountains2924-337725-350.78-0.94Shrub
    Qamdo region3797-68080-5Primarosol0.78-0.94Shrub
    Bomê-western Sichuan region347-15910-5Primarosol, anthropogenic soil0.78-0.94Shrub
    Sichuan region347-15910-5Primarosol, anthropogenic soilShrub, other forests
    Jinsha river-Chuxiong, Yuxi region1591-20690-5Primarosol0.72-0.78Shrub
    Northern Yunnan region3797-454825-35Primarosol0.78-0.94Sparse grass

    Table 3.

    Water yield identification for important areas in different climatic and geomorphological zones in the Hengduan Mountain region

    4 Conclusions and discussion

    4.1 Conclusions

    Identification of the spatial heterogeneity of ecosystem services and their controlling factors is an important component of ecosystem service research and is the scientific basis for territorial spatial planning and regional resources and environmental carrying capability. The Hengduan Mountain region is located in the upstream area of many major rivers in China and Southeast Asia. The complex topography and diverse climate types have enhanced the complexity of the spatial heterogeneity of water yield service to a certain extent. In this study, we constructed a research framework for the attribution analysis of the spatial heterogeneity of water yield in different geomorphological and climatic zones in mountain regions. Based on the simulated water yield service from the InVEST software, we identified the main controlling factors for the spatial heterogeneity of water yield service and the important areas of water yield by using the geographical detector method. The main conclusions are as follows:

    (1) Compared with other types of influencing factors, climatic factors had the strongest explanatory power for the spatial heterogeneity of water yield. Precipitation and actual evapotranspiration were the main factors, and the explanatory power of temperature was extremely limited.

    (2) The explanatory power of different factors for water yield spatial heterogeneity varied across different geomorphological zones. In flat areas (including plains and platforms), the actual evapotranspiration had the strongest explanatory power, followed by the land use type. Future regional development should pay more attention to the transfer and changes in the type of land use. The explanatory power of precipitation was gradually enhanced as the degree of relief increased. This area was mainly affected by climatic factors, and the explanatory degree of land use related factors was significantly reduced.

    (3) The controlling factors and the explanatory degree of each influencing factor for the spatial heterogeneity of water yield varied depending on climate type. In plateau climatic regions (Qamdo and Bomê-western Sichuan), the actual evapotranspiration had the strongest interpretation ability, and the interactions between this and other factors were the main contributor. In terms of the mid-subtropical climate zone (mainly including the northern Yunnan region), the explanatory power of precipitation increased and exceeded that of actual evapotranspiration to become the main controlling factor. At the same time, the interactions between land use type and other factors had strong explanatory power; therefore, more attention should be paid to regional land use changes.

    (4) The distribution of important areas of water yield service was identified by using the risk detector. The Primarosol and Anthropogenic soil areas, shrub distribution areas, and the areas with slopes of less than 5° and between 25° and 35° represented the most important water yield areas. The elevation of high water yield service values varied greatly in different geomorphological and climatic zones. For plains, platforms, small relief mountains, medium relief mountains, and large relief mountains, the high water yield areas were located mainly between elevations of 2069 m and 2484 m. Maximum yield elevation was 3377-3797 m for hilly areas and 2924-3377 m for the extreme relief mountains. In each climatic zone, the distribution of important water yield areas was strongly focused on the lower elevations of the Bomê-western Sichuan region and the Sichuan region, ranging from 347 m to 1591 m. Important water yield elevations in the Jinsha river-Chuxiong, Yuxi region was 1591-2069 m, and the distribution in northern Yunnan and Qamdo regions were relatively higher, ranging from 3797-4548 m and 3797-6808 m.

    4.2 Discussion

    Ecosystem service is affected by multiple influencing factors and the interactions between different factors. However, the coupling mechanism of multiple driving factors and the contribution of each factor to different ecosystem services remains a challenging problem. In this study, we attempted to identify the main controlling factors for the spatial heterogeneity of water yield service by using the geographical detector method. Both the single factor detector and the analysis of interactions between different factors were consistent with other studies and showed that climate related factors are the main controlling factors and have the strongest explanatory power for the spatial heterogeneity of water yield (Delphin et al., 2016; Sun et al., 2011). The precipitation and actual evapotranspiration were the main controlling factors in different geomorphological and climatic zones (Figure 3). Although the results highlighted the driving roles of climate related factors, the contribution of other factors to water yield service should not be disregarded. For example, in plains, platforms, and hilly areas, land use type was the main influencing factor and was second only to precipitation and actual evapotranspiration overall. The contribution of land use type exceeded 50%, particularly in the plains and platforms (Figure 4). These regions also contain the majority of terrain occupied by cultivated land, cities, and other infrastructure projects related to the implementation of the “National New Urbanization Planning” (Lu and Chen, 2015) and “Rural Vitalization” (Liu, 2018) policies. The distribution of land use types will change accordingly in the future; consequently, future urban and economic development processes should pay special attention to intensive land use and reasonable planning to minimize the impacts on water yield service in mountainous areas. Some studies have shown that landscape patterns such as aggregation or fragmentation have certain promoting or inhibiting effects on the expression of ecosystem services (Su et al., 2012; Jordan et al., 2005). Nonetheless, in this study, the explanatory power of each landscape metric on the spatial heterogeneity of water yield was extremely limited (the q value was all less than 10%). This inconsistency may be related to the scale of the calculation. On the one hand, our study calculated the water yield, landscape metrics, and attribution analysis based on a scale of 1 km, which does not consider the most detailed information on spatial differences in land use structure. On the other hand, the selection of the sliding window size in the calculation of the landscape metrics also affects the research results to a certain extent. Subsequent studies should be microscopic in scale and execute research on the impact of landscape structure on ecosystem services with a special focus on the clarification of the scale effect of land use structure.

    A certain degree of uncertainty existed in the entire process of evaluation of water yield service. Firstly, the raster formed meteorological data would be affected by some factors such as the selection of meteorological stations and interpolation methods. The impacts of these uncertainties would be more complex in mountain regions. Secondly, the water yield module in the InVEST software failed to include the impact of complex terrain. Thirdly, we analyzed water yield service for only one year and ignored the intra-annual and inter-annual variations. Future research should focus more on the evaluation and analysis of the time scale for water yield service. Revealing the impacts of land use structure on the spatial heterogeneity of water yield service is a challenge. In future studies, attribution analysis of water yield should be performed on a variety of spatial scales, which would help clarify the scale-dependent issues of the attribution analysis.

    References

    [1] M A A Ahmed, A Abd-Elrahman, F J Escobedo et al. Spatially-explicit modeling of multi-scale drivers of aboveground forest biomass and water yield in watersheds of the Southeastern United States. Journal of Environmental Management, 199, 158-171(2017).

    [2] I J Bateman, A R Harwood, G M Mace et al. Bringing ecosystem services into economic decision-making: Land use in the United Kingdom. Science, 341, 45-50(2013).

    [3] M I Budyko. Climate and Life(1974).

    [4] L Chen, G Xie, C Zhang et al. Modelling ecosystem water supply services across the Lancang River Basin. Journal of Resources and Ecology, 2, 322-327(2011).

    [5] G C Daily. Nature's Services: Societal Dependence on Natural Ecosystems(1997).

    [6] S Delphin, F J Escobedo, A Abd-Elrahman et al. Urbanization as a land use change driver of forest ecosystem services. Land Use Policy, 54, 188-199(2016).

    [7] S Díaz, S Demissew, J Carabias et al. The IPBES conceptual framework: Connecting nature and people. Current Opinion in Environmental Sustainability, 14, 1-16(2015).

    [8] B Fu, G Zhou, Y Bai et al. The main terrestrial ecosystem services and ecological security in China. Advances in Earth Science, 24, 571-576(2009).

    [9] J H Goldstein, G Caldarone, T K Duarte et al. Integrating ecosystem-service tradeoffs into land-use decisions. Proceedings of the National Academy of Sciences of the United States of America, 109, 7565-7570(2012).

    [10] A D Guerry, S Polasky, J Lubchenco et al. Natural capital and ecosystem services informing decisions: From promise to practice. Proceedings of the National Academy of Sciences of the United States of America, 112, 7348-7355(2015).

    [11] W Hou, J Gao, E Dai et al. The runoff generation simulation and its spatial variation analysis in Sanchahe basin as the south source of Wujiang. Acta Geographica Sinica, 73, 1268-1282(2018).

    [12] Y Hu, J Peng, Y Liu et al. Integrating ecosystem services trade-offs with paddy land-to-dry land decisions: A scenario approach in Erhai Lake Basin, southwest China. Science of the Total Environment, 625, 849-860(2018).

    [13] C Jiang, H Zhang, Z Zhang. Spatially explicit assessment of ecosystem services in China's Loess Plateau: Patterns, interactions, drivers, and implications. Global and Planetary Change, 161, 41-52(2018).

    [14] G Jordan, A van Rompaey, P Szilassi et al. Historical land use changes and their impact on sediment fluxes in the Balaton basin (Hungary). Agriculture Ecosystems & Environment, 108, 119-133(2005).

    [15] N Larondelle, D Haase. Urban ecosystem services assessment along a rural-urban gradient: A cross-analysis of European cities. Ecological Indicators, 29, 179-190(2013).

    [16] W Li, B Zhang, G Xie. Research on ecosystem services in China: Progress and perspectives. Journal of Natural Resources, 24, 1-10(2009).

    [17] P Liang, X P Yang. Landscape spatial patterns in the Maowusu (Mu Us) Sandy Land, northern China and their impact factors. Catena, 145, 321-333(2016).

    [18] S Lin, R Wu. The spatial pattern of water supply ecosystem services in the Three Parallel Rivers Region. Journal of West China Forestry Science, 44, 8-15(2015).

    [19] C Liu, C Wang, L Liu. Spatio-temporal variation on habitat quality and its mechanism within the transitional area of the Three Natural Zones: A case study in Yuzhong count. Geographical Research, 37, 419-432(2018).

    [20] J Liu, Z Zhang, X Xu et al. Spatial patterns and driving forces of land use change in China during the early 21st century. Journal of Geographical Sciences, 20, 483-494(2010).

    [21] M Liu, X Sun, H Lin et al. Establishment of eco-compensation fund based on the consumption of ecosystem services for Beijing-Chengde. Resources Science, 37, 1536-1542(2015).

    [22] Y Liu. Research on the urban-rural integration and rural revitalization in the new era in China. Acta Geographica Sinica, 73, 637-650(2018).

    [23] C R Lou, H Y Liu, Y F Li et al. Socioeconomic drivers of PM2.5 in the accumulation phase of air pollution episodes in the Yangtze River Delta of China. International Journal of Environmental Research and Public Health, 13, 1-19(2016).

    [24] D Lu, M Chen. Several viewpoints on the background of compiling the “National New Urbanization Planning (2014-2020)”. Acta Geographica Sinica, 70, 179-185(2015).

    [25] K Mcgarigal, B J Marks. FRAGSTATS: spatial pattern analysis program for quantifying landscape structure. Gen. Tech. Rep. PNW-GTR-351, 122(1995).

    [26] Ecosystem Assessment Millennium. Ecosystems and Human Well-Being.

    [27] C Qian, J Gong, J Zhang et al. Change and tradeoffs-synergies analysis on watershed ecosystem services: A case study of Bailongjiang Watershed, Gansu. Acta Geographica Sinica, 73, 868-879(2018).

    [28] M Sánchez-Canales, A L Benito, A Passuello et al. Sensitivity analysis of ecosystem service valuation in a Mediterranean watershed. Science of the Total Environment, 440, 140-153(2012).

    [29] S Su, R Xiao, Z L Jiang et al. Characterizing landscape pattern and ecosystem service value changes for urbanization impacts at an eco-regional scale. Applied Geography, 34, 295-305(2012).

    [30] G Sun, P Caldwell, A Noormets et al. Upscaling key ecosystem functions across the conterminous United States by a water-centric ecosystem model. Journal of Geophysical Research Biogeosciences, 116, 1-16(2011).

    [31] H Tao, Z Pan, M Pan et al. Mixing spatial-temporal transmission patterns of metropolis dengue fever: A case study of Guangzhou, China. Acta Geographica Sinica, 71, 1653-1662(2016).

    [32] The Economics of Ecosystems and Biodiversity for Water and Wetlands. IEEP, London and Brussels; Ramsar Secretariat Gland(2013).

    [33] M G Turner, D C Donato, W H Romme. Consequences of spatial heterogeneity for ecosystem services in changing forest landscapes: Priorities for future research. Landscape Ecology, 28, 1081-1097(2013).

    [34] J F Wang, Y Hu. Environmental health risk detection with GeogDetector. Environmental Modelling & Software, 33, 114-115(2012).

    [35] J F Wang, X H Li, G Christakos et al. Geographical detectors-based health risk assessment and its application in the neural tube defects study of the Heshun region, China. International Journal of Geographical Information Science, 24, 107-127(2010).

    [36] J Wang, J Peng, M Zhao et al. Significant trade-off for the impact of Grain-for-Green Programme on ecosystem services in north-western Yunnan, China. Science of the Total Environment, 574, 57-64(2017).

    [37] J Wang, C Xu. Geodetector: Principle and prospective. Acta Geographica Sinica, 72, 116-134(2017).

    [38] S Wang, Y Wang, X Lin et al. Spatial differentiation patterns and influencing mechanism of housing prices in China: Based on data of 2872 counties. Acta Geographica Sinica, 71, 1329-1342(2016).

    [39] L Zhang, W R Dawes, G R Walker. Response of mean annual evapotranspiration to vegetation changes at catchment scale. Water Resources Research, 37, 701-708(2001).

    [40] R Zhang, D Zheng, Q Yang et al. Physical Geography of Hengduan Mountain Area(1997).

    [41] C Zhou, W Cheng, J Qian et al. Research on the classification system of digital land geomorphology of 1:1000000 in China. Journal of Geo-information Science, 11, 707-724(2009).

    [42] W Zhou, G Liu, J Pan et al. Distribution of available soil water capacity in China. Journal of Geographical Sciences, 15, 3-12(2005).

    Erfu DAI, Yahui WANG. Attribution analysis for water yield service based on the geographical detector method: A case study of the Hengduan Mountain region[J]. Journal of Geographical Sciences, 2020, 30(6): 1005
    Download Citation