• Acta Optica Sinica
  • Vol. 38, Issue 7, 0710003 (2018)
Yongli Chang, Sumei Li*, Jiajie Hu, and Xu Han
Author Affiliations
  • School of Electrical and Information Engineering, Tianjin University, Tianjin 300072, China
  • show less
    DOI: 10.3788/AOS201838.0710003 Cite this Article Set citation alerts
    Yongli Chang, Sumei Li, Jiajie Hu, Xu Han. Measurement of Comfortable Range of Stereo Image Saturation Based on Salient Region[J]. Acta Optica Sinica, 2018, 38(7): 0710003 Copy Citation Text show less
    Four source of stereo images. (a) Pingpang.bmp; (b) signboard.bmp; (c) kid.bmp; (d) flower.bmp
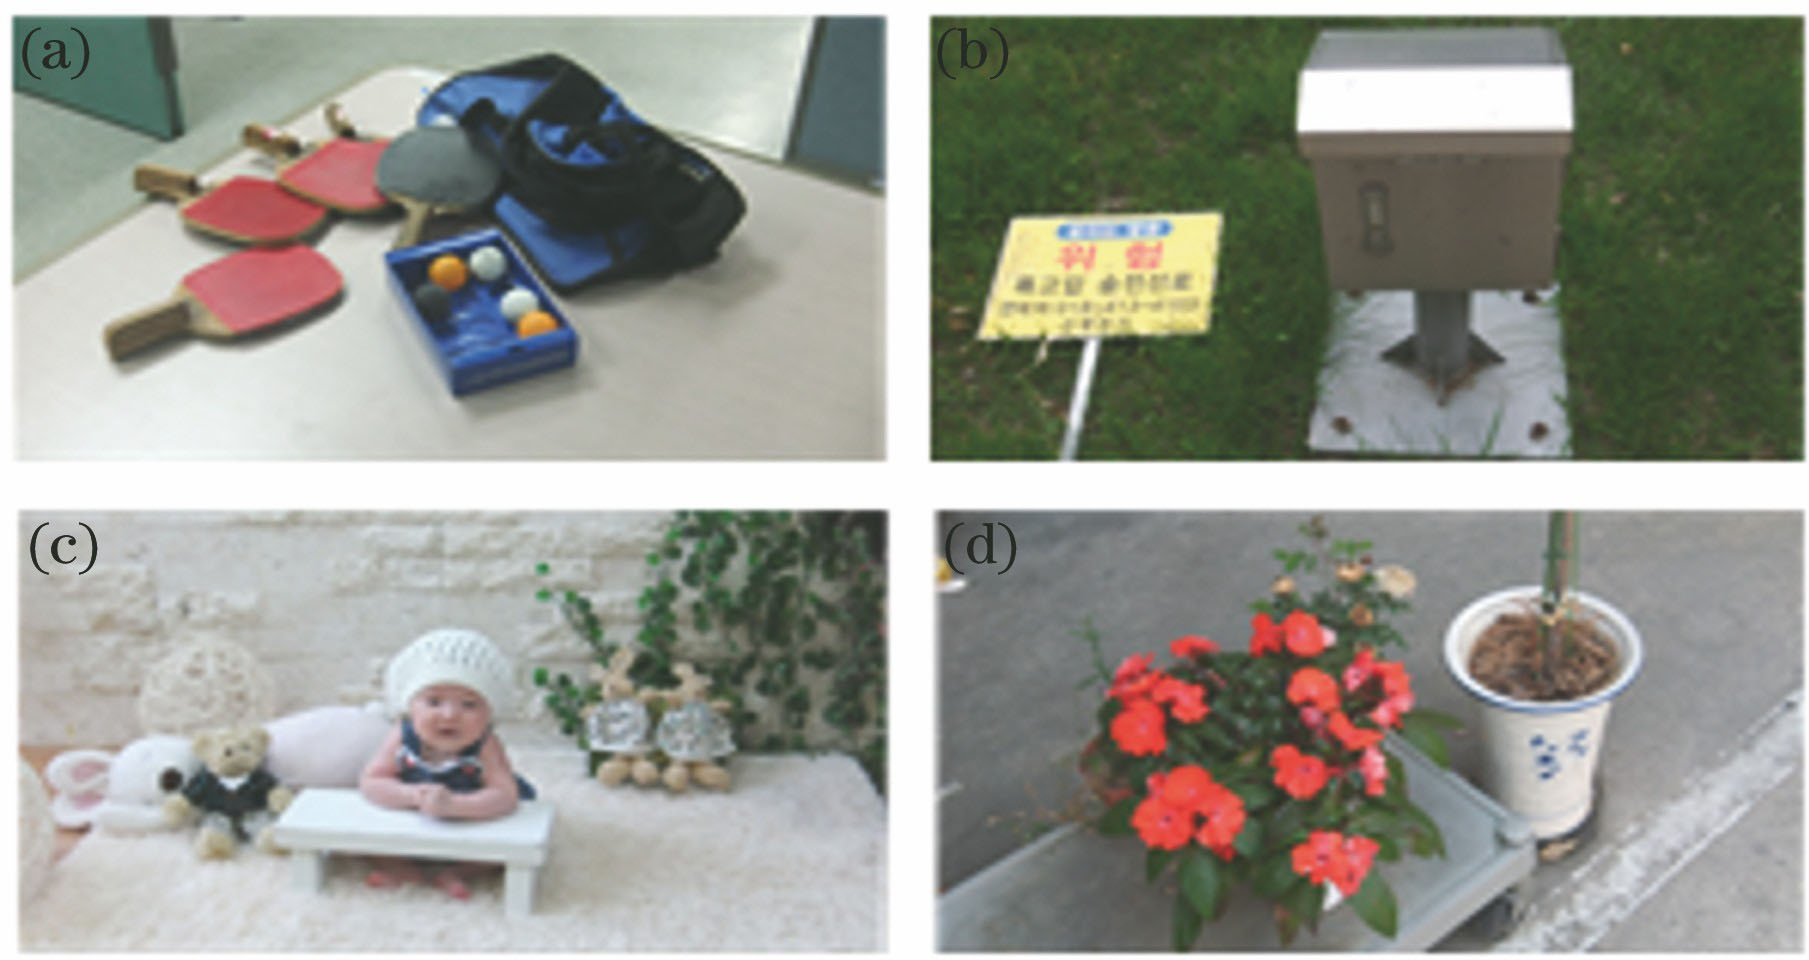
    Fig. 1. Four source of stereo images. (a) Pingpang.bmp; (b) signboard.bmp; (c) kid.bmp; (d) flower.bmp
    Algorithm flowchart
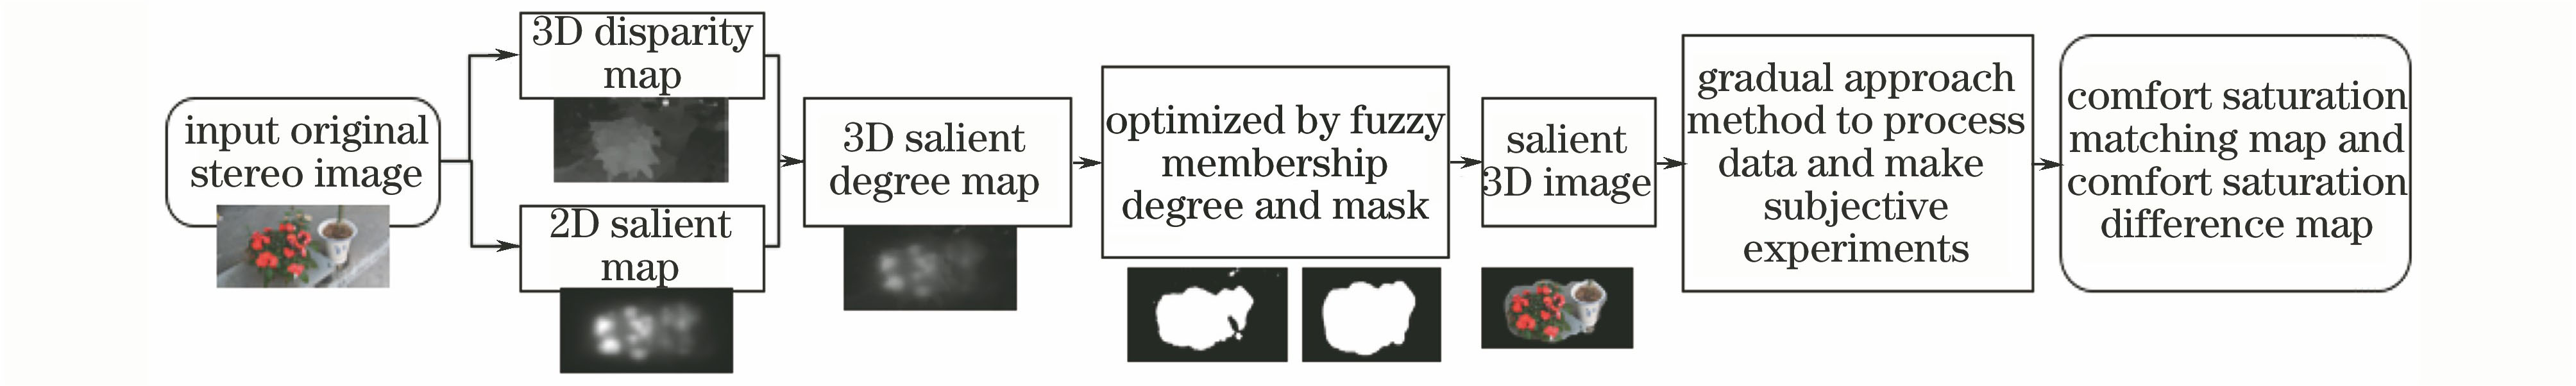
    Fig. 2. Algorithm flowchart
    Extraction process of salient stereo image. (a) Right view; (b) disparity map; (c) planar salient map; (d) stereo salient map; (e) mask image; (f) optimized mask image; (g) salient stereo image
    Fig. 3. Extraction process of salient stereo image. (a) Right view; (b) disparity map; (c) planar salient map; (d) stereo salient map; (e) mask image; (f) optimized mask image; (g) salient stereo image
    Salient hot map of eye tracker experiment. (a)Pingpang.bmp; (b)signboard.bmp; (c)kid.bmp; (d)flower.bmp
    Fig. 4. Salient hot map of eye tracker experiment. (a)Pingpang.bmp; (b)signboard.bmp; (c)kid.bmp; (d)flower.bmp
    Four groups of stereo image comfortable saturation matching image
    Fig. 5. Four groups of stereo image comfortable saturation matching image
    Four groups of stereo image comfortable saturation difference image
    Fig. 6. Four groups of stereo image comfortable saturation difference image
    Comfortable saturation matching map of stereo image
    Fig. 7. Comfortable saturation matching map of stereo image
    Comfortable saturation difference map of stereo image
    Fig. 8. Comfortable saturation difference map of stereo image
    Comparison of the difference map of comfortable saturation between experiment and reference[7]
    Fig. 9. Comparison of the difference map of comfortable saturation between experiment and reference[7]
    Two source of stereo images. (a) Flower one.bmp (b) boy.bmp
    Fig. 10. Two source of stereo images. (a) Flower one.bmp (b) boy.bmp
    ScoreDescriptionGrade
    5Equally viewing comfortVery comfortable
    4Slightly reduced viewing comfortComfortable
    3Reduced viewing comfortFair
    2Considerably reduced viewing comfortUncomfortable
    1Extremely reduced viewing comfortVery uncomfortable
    Table 1. Subjective evaluation level of stereoscopic images comfort
    Scene categoryPingpang.bmpSignboard.bmpFlower.bmpKid.bmp
    Maximum range of positive saturation difference[0,0.29][0,0.28][0,0.31][0,0.27]
    Maximum range of negative saturation difference[-0.26,0][-0.28,0][-0.24,0][-0.26,0]
    Table 2. Threshold of saturation difference in four scenes
    Yongli Chang, Sumei Li, Jiajie Hu, Xu Han. Measurement of Comfortable Range of Stereo Image Saturation Based on Salient Region[J]. Acta Optica Sinica, 2018, 38(7): 0710003
    Download Citation