• Spectroscopy and Spectral Analysis
  • Vol. 42, Issue 7, 2225 (2022)
Ai-ping ZHAO1、*, Jun-cheng MA1、1;, Yong-feng WU1、1; *;, Xin HU2、2;, De-chao REN2、2;, and Chong-rui LI1、1;
Author Affiliations
  • 11. Institute of Environment and Sustainable Development in Agriculture, Chinese Academy of Agricultural Sciences, Beijing 100081, China
  • 22. Wheat Research Institute, Shangqiu Academy of Agriculture and Forestry Sciences, Shangqiu 476000, China
  • show less
    DOI: 10.3964/j.issn.1000-0593(2022)07-2225-08 Cite this Article
    Ai-ping ZHAO, Jun-cheng MA, Yong-feng WU, Xin HU, De-chao REN, Chong-rui LI. Predicting Yield Reduction Rates of Frost-Damaged Winter Wheat After Jointing Using Sentinel-2 Broad-Waveband Spectral Indices[J]. Spectroscopy and Spectral Analysis, 2022, 42(7): 2225 Copy Citation Text show less
    Spatial distribution of winter wheat planting area and the distribution of random sampling points
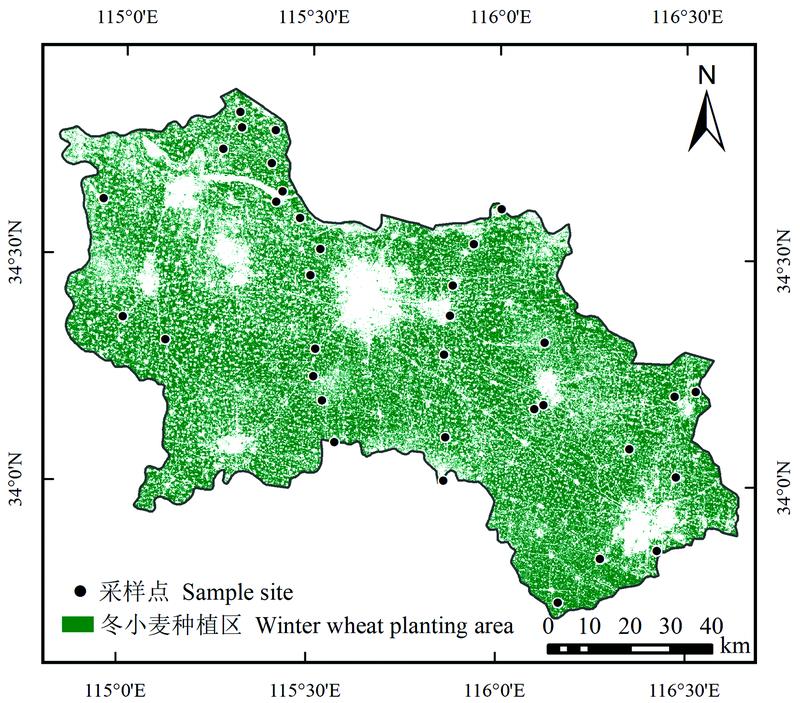
    Fig. 1. Spatial distribution of winter wheat planting area and the distribution of random sampling points
    Reflectance curves of winter wheat canopy during the dimple occurrence (a) and the stigma elongation (b) under low-temperature treatmentsNote: CK is the control, without low-temperature treatment, normal growth; Wavebands of 1 340~1 450 and 1 800~2 050 nm are removed due to strong absorption of water vapor
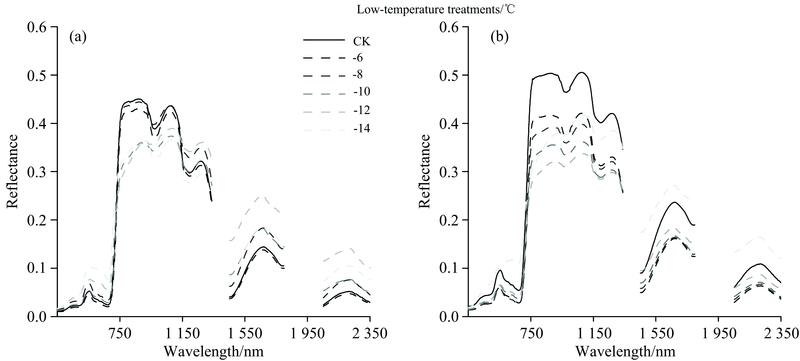
    Fig. 2. Reflectance curves of winter wheat canopy during the dimple occurrence (a) and the stigma elongation (b) under low-temperature treatments
    Note: CK is the control, without low-temperature treatment, normal growth; Wavebands of 1 340~1 450 and 1 800~2 050 nm are removed due to strong absorption of water vapor
    Scatter plots showing the measured and predicted yield reduction rates of winter wheat based on the constructed spectral indices B8a-B12 (a), B8-B12 (b) in this study and the published spectral index EVI (c)
    Fig. 3. Scatter plots showing the measured and predicted yield reduction rates of winter wheat based on the constructed spectral indices B8a-B12 (a), B8-B12 (b) in this study and the published spectral index EVI (c)
    Spatial distribution of the winter wheat predicted yield reduction rates by the constructed spectral index B8a-B12 in this study
    Fig. 4. Spatial distribution of the winter wheat predicted yield reduction rates by the constructed spectral index B8a-B12 in this study
    类型光谱指数符号表达式文献
    宽波段
    光谱指数
    归一化植被指数NDVI(RNIR-RR)/(RNIR+RR)[8]
    绿波段归一化植被指数GNDVI(RNIR-RG)/(RNIR+RG)[8]
    比值植被指数RVIRNIR/RR[8]
    差值植被指数DVIRNIR-RR[8]
    增强植被指数EVI2.5(RNIR-RR)/(RNIR+6RR-7.5RB+1)[8]
    可见大气阻抗指数VARIgreen(RG-RR)/(RG+RR-RB)[5]
    窄波段
    光谱指数
    比值植被指数RVI_800_450R800/R450[8]
    三角绿色指数TGI-0.5(190(R670-R550)-120(R670-R480))[2]
    归一化差异水分指数NDWI1640(R858-R1640)/(R858+R1640)[5]
    归一化差异水分指数NDWI2130(R858-R2130)/(R858+R2130)[5]
    归一化多波段干旱指NMDI[R860-(R1640-R2130)]/[R860+(R1640-R2130)][15]
    归一化差异红指数NDII(R850 -R1650)/(R850+R1650)[5]
    水分胁迫MSIR1600/R820[16]
    Datt指数Datt-I(R850-R710)/(R850-R680)[16]
    水波段指数WBIR950/R900[16]
    改进叶绿素吸收率指数MCARI[(R700-R670)-0.2(R700-R550)]×(R700/R670)[2]
    改进三角植被指数MTVI2(1.5(1.2(R800-R550)-2.5(R670-R550))/((2R800+1)2-
    (6R800-5R6701/2)-0.5)1/2)
    [17]
    改进叶绿素吸收率指数/
    改进三角植被指数
    MCARI/MTVI2[(R700-R670)-0.2(R700-R550)]×(R700/R670)/MTVI2[17]
    生理反射PRI(R550-R531)/(R550+R531)[2]
    Table 1. Published spectral indices and corresponding expressions selected in this study
    光谱波段光谱范围/nm波段宽度/nm空间分辨率/m
    B1433~4532060
    B2458~5236510
    B3543~5783510
    B4650~6803010
    B5698~7131520
    B6733~7481520
    B7773~7932020
    B8785~90011510
    B8a855~8752020
    B9930~9502060
    B111 565~1 6559020
    B122 100~2 28018020
    Table 2. Essential parameters of the selected Sentinel-2 wavebands in this study
    光谱指数重采样前重采样后
    相关系数p相关系数p
    MCARI0.0900.450-0.2600.028
    MTVI2-0.8620.000-0.8500.000
    TGI-0.3830.001-0.0310.794
    WBI0.8610.0000.6330.000
    NDWI1640-0.7160.000-0.6900.000
    NDWI2130-0.8480.000-0.8440.000
    NMDI-0.4170.0000.7940.000
    RVI_800_450-0.6950.000-0.6260.000
    EVI-0.8460.000-0.8350.000
    VARIgreen-0.6820.000-0.7190.000
    NDVI-0.7740.000-0.7270.000
    GNDVI-0.7960.000-0.7090.000
    RNDVI-0.7960.000-0.7090.000
    RVI-0.6340.000-0.6730.000
    DVI-0.7200.000-0.8140.000
    NDII-0.8470.000-0.7400.000
    MSI0.6880.0000.7290.000
    Datt-I-0.5110.000-0.6410.000
    PRI-0.4740.000-0.3490.003
    Table 3. Correlation analysis between published spectral indices and yield reduction rates of winter wheat
    构建形式光谱指数校正集验证集
    线性回归方程R2RMSE/%R2RMSE/%
    EVIy=-221.28 x+170.560.73315.5940.63115.513
    已有NDWI2130y=-174.45 x+155.590.68117.0400.76910.375
    MTVI2y=-189.26x+144.550.74915.0940.67114.128
    (B8a-B9)/(B8a+B9)y=-1 343.38x+58.070.70017.8660.75212.014
    归一化(B7-B11)/(B7+B11)y=-157.82x+95.420.69418.0400.8518.700
    (B8a-B12)/(B8a+B12)y=-181.6x+160.380.68918.2010.77810.338
    B8-B12y=-380.01x+149.820.77615.4370.71714.253
    简单差值B8a-B12y=-389.68x+152.40.75216.2350.68115.200
    B8a-B9y=-1 812.36x+58.710.72517.0940.74112.792
    B11/B7y=132.17x-26.330.70917.5900.8339.391
    简单比值B11/B6y=122.93x-32.670.68018.4540.79610.083
    B9/B8ay=682.82x-625.140.70217.8210.75411.919
    Table 4. Accuracy of linear regression equations of published and constructed spectral indices in this study on predicting the yield reduction rates of winter wheat
    构建形式光谱指数R2RMSE/%P values
    EVI0.4869.0300.000
    已有NDWI21300.32410.3480.000
    MTVI20.36710.0150.000
    (B8a-B9)/(B8a+B9)0.00612.5540.671
    归一化(B7-B11)/(B7+B11)0.3759.9510.000
    (B8a-B12)/(B8a+B12)0.35710.0960.001
    B8-B120.4928.9710.000
    简单差值B8a-B120.5438.5100.000
    B8a-B90.01212.5140.537
    B11/B70.3799.9220.000
    简单比值B11/B60.34410.1950.000
    B9/B8a0.00612.5480.647
    Table 5. Accuracy of the linear regression based on the Sentinel-2 broad-waveband spectral indices in predicting the yield reduction rates of winter wheat
    Ai-ping ZHAO, Jun-cheng MA, Yong-feng WU, Xin HU, De-chao REN, Chong-rui LI. Predicting Yield Reduction Rates of Frost-Damaged Winter Wheat After Jointing Using Sentinel-2 Broad-Waveband Spectral Indices[J]. Spectroscopy and Spectral Analysis, 2022, 42(7): 2225
    Download Citation