• Photonics Research
  • Vol. 9, Issue 4, 610 (2021)
Shengchao Gong1, Mengxin Ren1、2、*, Wei Wu1, Wei Cai1, and Jingjun Xu1、3
Author Affiliations
  • 1The Key Laboratory of Weak-Light Nonlinear Photonics, Ministry of Education, School of Physics and TEDA Applied Physics Institute, Nankai University, Tianjin 300071, China
  • 2Collaborative Innovation Center of Extreme Optics, Shanxi University, Taiyuan 030006, China
  • 3e-mail: jjxu@nankai.edu.cn
  • show less
    DOI: 10.1364/PRJ.416189 Cite this Article Set citation alerts
    Shengchao Gong, Mengxin Ren, Wei Wu, Wei Cai, Jingjun Xu. Optically addressed spatial light modulator based on nonlinear metasurface[J]. Photonics Research, 2021, 9(4): 610 Copy Citation Text show less
    Operation principle of an MS-OASLM. (a) An illustration for the MS-OASLM. Write beams (green arrows) with different intensities cause a spatially heterogeneous photoisomerization (trans state to cis state) of ethyl-red azo molecules and selectively tune optical responses of the MS. This consequently affects readout light polarization in a nonlinear manner, as indicated by the differently rotated red arrow plane in the transmission side. Inset gives an SEM image of the MS unit cell. (b) Transmission spectra of the MS for x-polarized read light. Irradiation of the write light causes a blue shift of the spectrum (red curve) compared with the initial situation (blue curve). Empty circles are experimental data, and solid lines are eye guides. (c) Nonlinear tuning of the read light polarization as a function of the write light power (Pw). The polarization state of light is defined by azimuth angle ϕ and ellipticity angle χ (defined in inset). Positive values of ϕ and χ correspond to clockwise rotation of polarization azimuth and right-handed ellipse, as observed against propagation direction. Under the write light irradiation, the ϕ-χ trajectory of the read light suffers a blue shift. (d) Modulation over the ϕ-χ curve of the read light at 820 nm. (e) Polarization ellipses of 820 nm read light under different Pw.
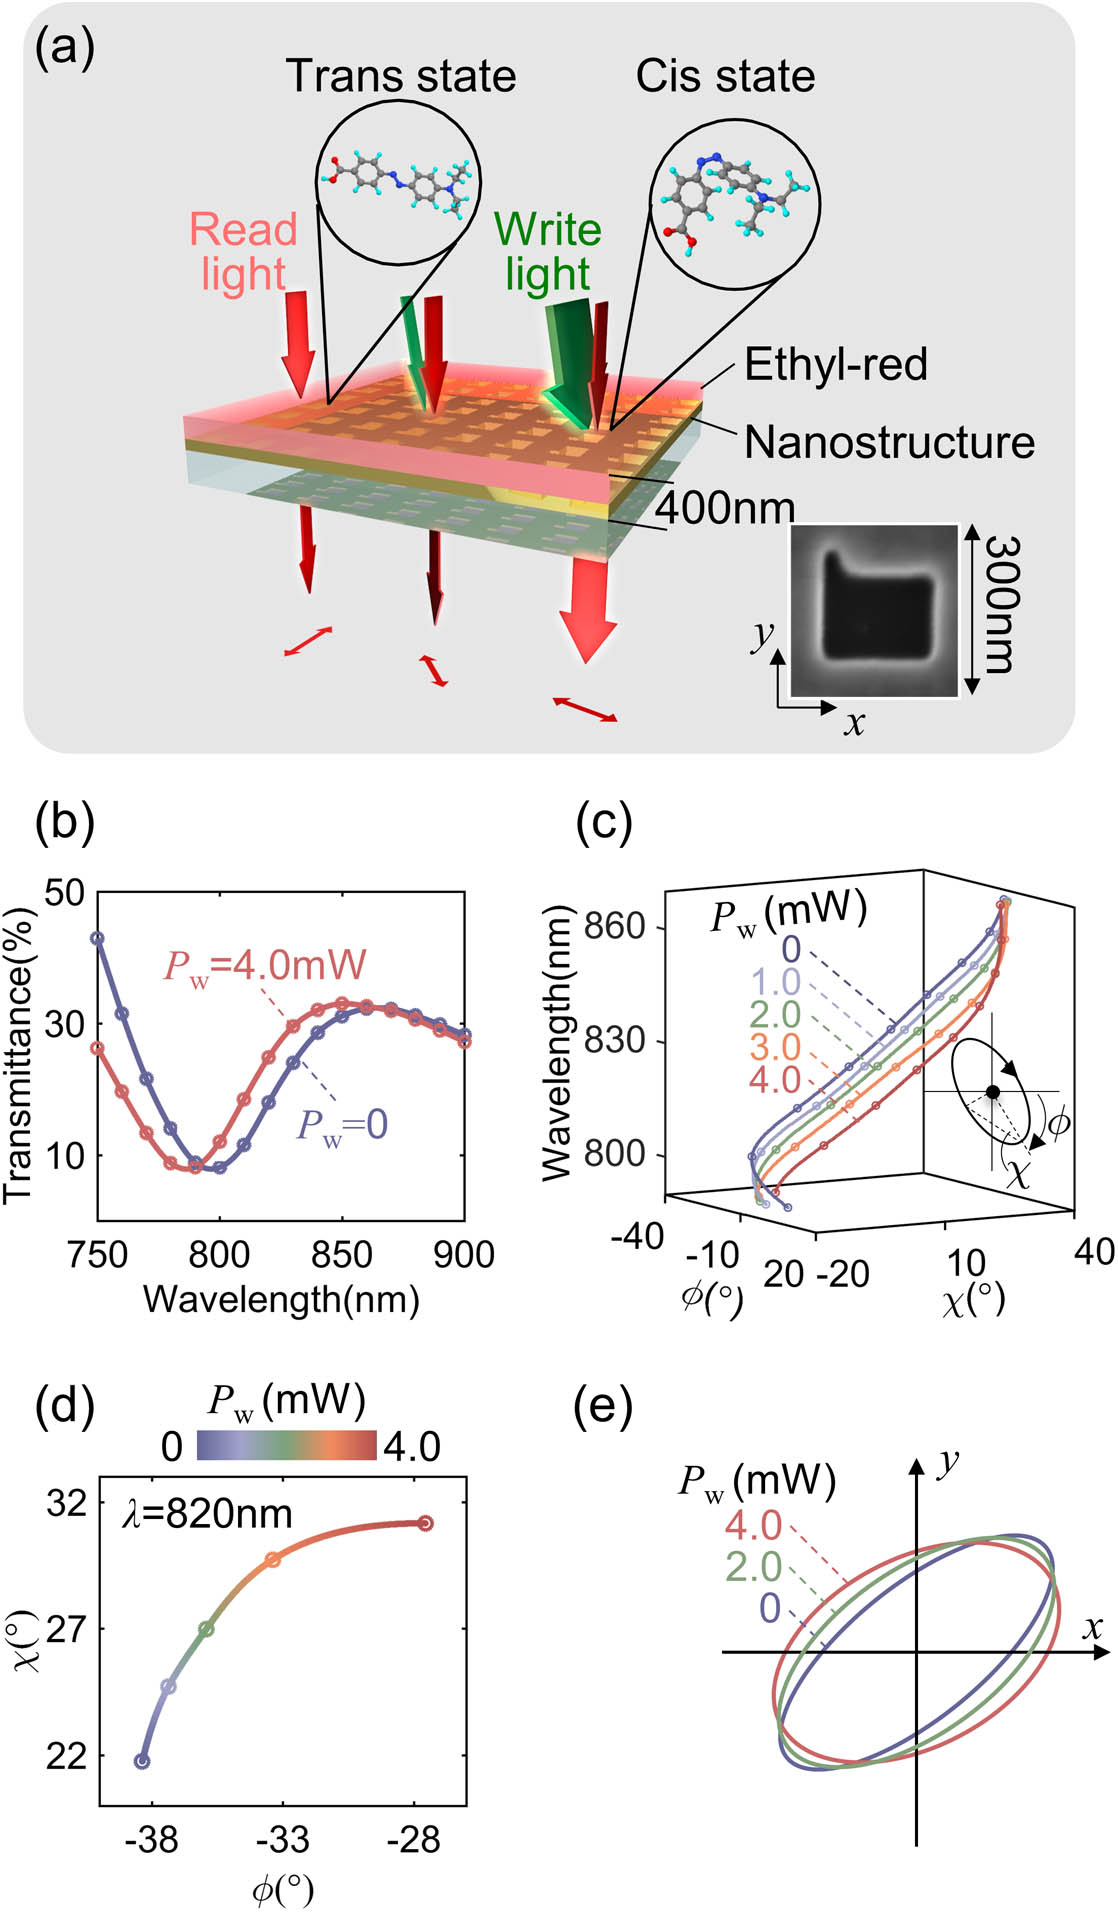
    Fig. 1. Operation principle of an MS-OASLM. (a) An illustration for the MS-OASLM. Write beams (green arrows) with different intensities cause a spatially heterogeneous photoisomerization (trans state to cis state) of ethyl-red azo molecules and selectively tune optical responses of the MS. This consequently affects readout light polarization in a nonlinear manner, as indicated by the differently rotated red arrow plane in the transmission side. Inset gives an SEM image of the MS unit cell. (b) Transmission spectra of the MS for x-polarized read light. Irradiation of the write light causes a blue shift of the spectrum (red curve) compared with the initial situation (blue curve). Empty circles are experimental data, and solid lines are eye guides. (c) Nonlinear tuning of the read light polarization as a function of the write light power (Pw). The polarization state of light is defined by azimuth angle ϕ and ellipticity angle χ (defined in inset). Positive values of ϕ and χ correspond to clockwise rotation of polarization azimuth and right-handed ellipse, as observed against propagation direction. Under the write light irradiation, the ϕ-χ trajectory of the read light suffers a blue shift. (d) Modulation over the ϕ-χ curve of the read light at 820 nm. (e) Polarization ellipses of 820 nm read light under different Pw.
    Image projection based on an MS-OASLM. (a) Schematic of the MS-OASLM image projection system. An input mask is imaged onto the MS plane using 532 nm green light and is duplicated in form of a spatially inhomogeneous polarization distribution in readout light. Such a polarization replica is transformed into an intensity replica by filtering through a combination of a waveplate and a polarizer. (b) Nonlinear intensity modulation ΔI transformed from polarization modulation. θW and θA are azimuth angles of the waveplate and analyzer, respectively. In the example shown, the wavelength of the read light is 820 nm. The maximum modulation is indicated by a white cross. ΔI is divided by the incident read light intensity (I0) to get rid of the influence of the power fluctuation of the read laser. (c) Nonlinear modulations to read light intensity at different wavelengths. Blue curve: only contribution from the nonlinear spectral shift in transmitted intensity is considered. For the wavelengths shorter than 790 nm or longer than 860 nm, ΔI is smaller than zero, which gives inverse images of the mask and was not used in our experiments. Red curve: both contributions of nonlinear changes in intensity and polarization are considered, which gives larger ΔI. The strongest modulation appears at 820 nm, to which the results are normalized. Empty circles are experimental data, and dash lines are eye guides.
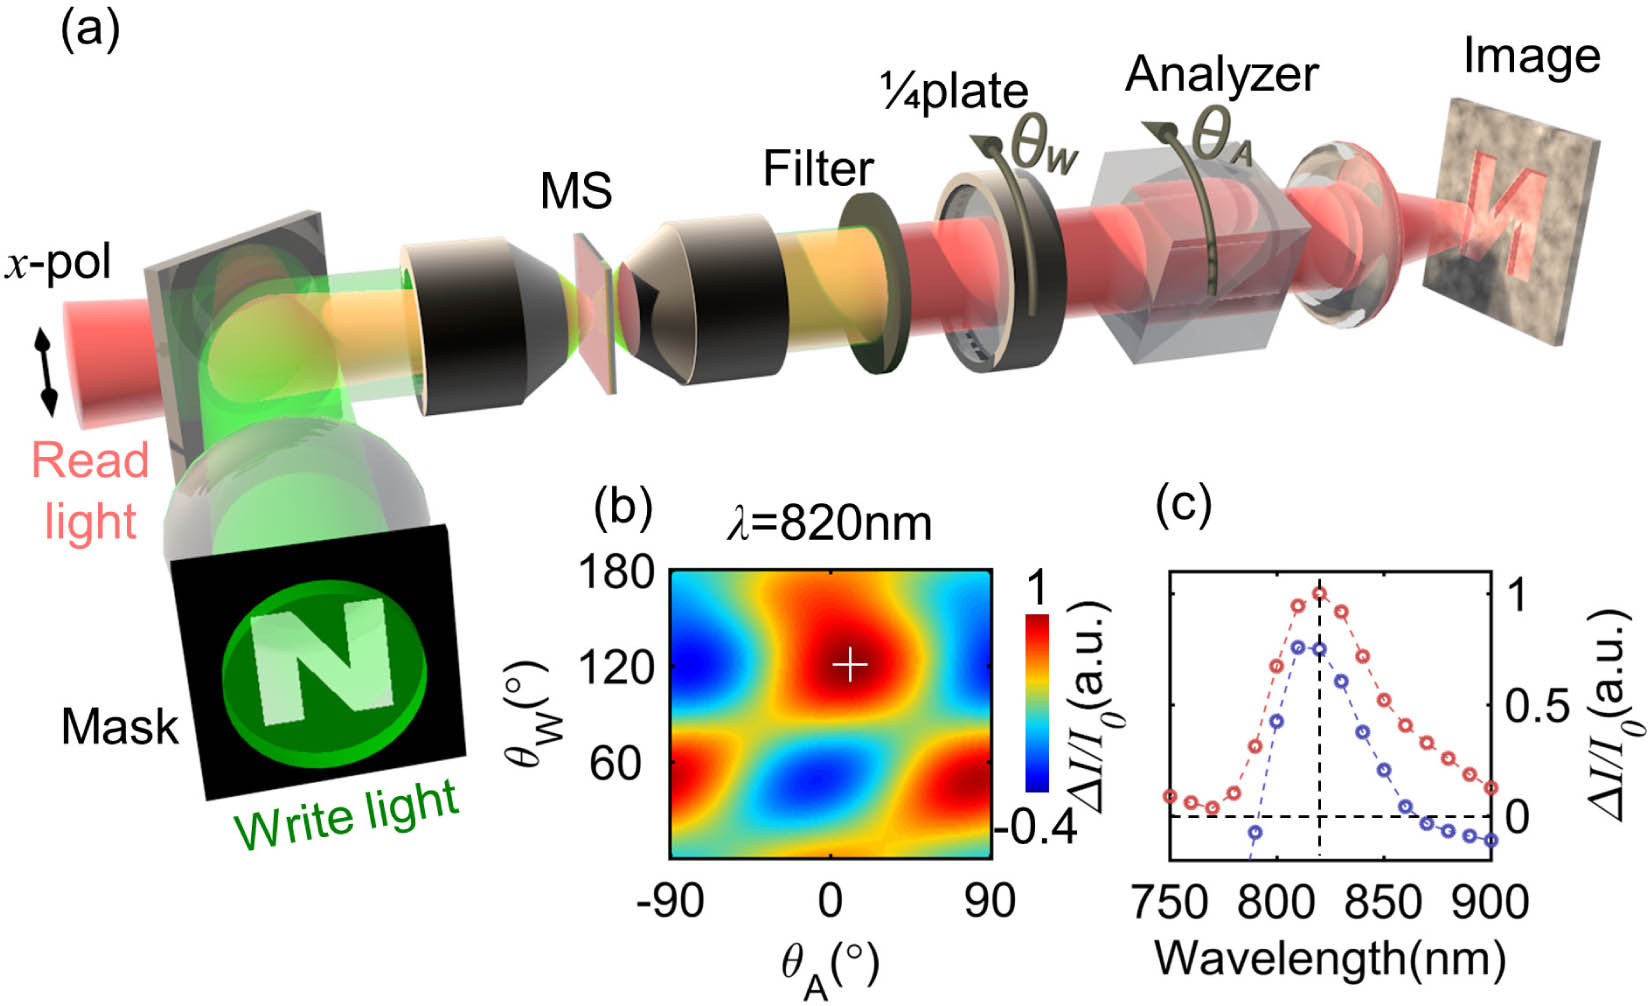
    Fig. 2. Image projection based on an MS-OASLM. (a) Schematic of the MS-OASLM image projection system. An input mask is imaged onto the MS plane using 532 nm green light and is duplicated in form of a spatially inhomogeneous polarization distribution in readout light. Such a polarization replica is transformed into an intensity replica by filtering through a combination of a waveplate and a polarizer. (b) Nonlinear intensity modulation ΔI transformed from polarization modulation. θW and θA are azimuth angles of the waveplate and analyzer, respectively. In the example shown, the wavelength of the read light is 820 nm. The maximum modulation is indicated by a white cross. ΔI is divided by the incident read light intensity (I0) to get rid of the influence of the power fluctuation of the read laser. (c) Nonlinear modulations to read light intensity at different wavelengths. Blue curve: only contribution from the nonlinear spectral shift in transmitted intensity is considered. For the wavelengths shorter than 790 nm or longer than 860 nm, ΔI is smaller than zero, which gives inverse images of the mask and was not used in our experiments. Red curve: both contributions of nonlinear changes in intensity and polarization are considered, which gives larger ΔI. The strongest modulation appears at 820 nm, to which the results are normalized. Empty circles are experimental data, and dash lines are eye guides.
    Read out images of binary masks and resolution test charts. (a) Binary masks include a series of letters, “I ♡ N K U”. First row gives optical images of the masks captured directly using green light (532 nm). Images read by the red beam (820 nm) are shown in the second row. Scale bar is 10 μm. (b) Images of different sized resolution test charts by the green light are given in the first and third rows, while images by the read beam are given in the second and fourth rows. The sizes of chart images are labeled beside each pattern. The charts with sizes of 5 μm are well recognized as three distinct lines, corresponding to a spatial resolution of 500 lp/mm.
    Fig. 3. Read out images of binary masks and resolution test charts. (a) Binary masks include a series of letters, “I ♡ N K U”. First row gives optical images of the masks captured directly using green light (532 nm). Images read by the red beam (820 nm) are shown in the second row. Scale bar is 10 μm. (b) Images of different sized resolution test charts by the green light are given in the first and third rows, while images by the read beam are given in the second and fourth rows. The sizes of chart images are labeled beside each pattern. The charts with sizes of 5 μm are well recognized as three distinct lines, corresponding to a spatial resolution of 500 lp/mm.
    Shengchao Gong, Mengxin Ren, Wei Wu, Wei Cai, Jingjun Xu. Optically addressed spatial light modulator based on nonlinear metasurface[J]. Photonics Research, 2021, 9(4): 610
    Download Citation