
Chenliang Ding, Dazhao Zhu, Chengpeng Ma, Mengbo Tang, Zhenyao Yang, Yong Liu, Cuifang Kuang, Xu Liu, "Method for active spatial alignment and stabilization of laser beams in multi-beam systems," Chin. Opt. Lett. 21, 031201 (2023)
- Chinese Optics Letters
- Vol. 21, Issue 3, 031201 (2023)
Abstract
1. Introduction
The interaction between the laser and the material is an effective way to break the diffraction limit, both for super-resolution imaging and lithography. With the development of stimulated emission depletion (STED)[1], resolution augmentation through photo-induced deactivation (RAPID) lithography[2], two-color photo-initiation/inhibition (2PII) lithography[3–5], and other theories, multi-beam systems become the inevitable trend of performance improvement. However, for these high-precision optical systems, fluctuations in the pointing of the laser beams significantly hinder further improvements in performance and applications. Therefore, the spatial alignment and stability of beams in multi-beam systems are critical for achieving the best results.
The pointing of the laser beam fluctuates along the long propagation paths from the light source to the target plane because of thermal expansion, mechanical vibrations, and spatial and temporal non-uniform nonlinear effects[6]. To minimize fluctuations, passive anti-drift is the conventional method that uses an optical platform and temperature control system. However, as the demand for precision of the system increases, the cost and technical difficulty increase significantly, making it difficult to meet the current requirements of multi-beam systems.
Different methods have been proposed to enhance beam spatial alignment and stability in various multi-beam systems. Using an optical fiber is an effective method to reduce deviations of laser beams[7] and can achieve spatial alignment by coupling two beams into the same fiber[8]. However, the dispersion effect of the optical fiber leads to pulse expansion of the femtosecond laser source, and many optical modulations still require spatial beams.
Sign up for Chinese Optics Letters TOC. Get the latest issue of Chinese Optics Letters delivered right to you!Sign up now
Therefore, it is highly meaningful to realize spatial alignment and stability of spatial beams. Methods based on the spatial light modulator (SLM) have been adapted to calibrate the central position of two beams in STED systems with a precision of
In this study, to achieve beam spatial alignment and stability automatically, we propose a new method that can be used for spatial alignment and stability of beams in multi-beam systems. The error separation technique that we previously proposed[21] was used in this method, which has the ability to avoid alignment errors caused by the coupling effect of piezoelectric devices, inaccurate correction calculations, and detection mode of angular deviation, compared with other previous calibration techniques. The spatial alignment and stability system of the double beams was built with a small size, and a pair of detectors was used to adjust the spatial alignment of the two beams, which can then exit with the same beam center and high stability. Thus, a higher alignment and stability accuracy can be achieved for further development of multi-beam systems.
2. Measurement and Alignment Principle
Figure 1(a) shows the optical system based on the error separation technique, which is described in the previous work, and the results show that the system can achieve high-precision correction and fast response with a small system size. However, the principles and advantages of this technique were not clearly analyzed in the previous work, which will be elaborated here.
![]()
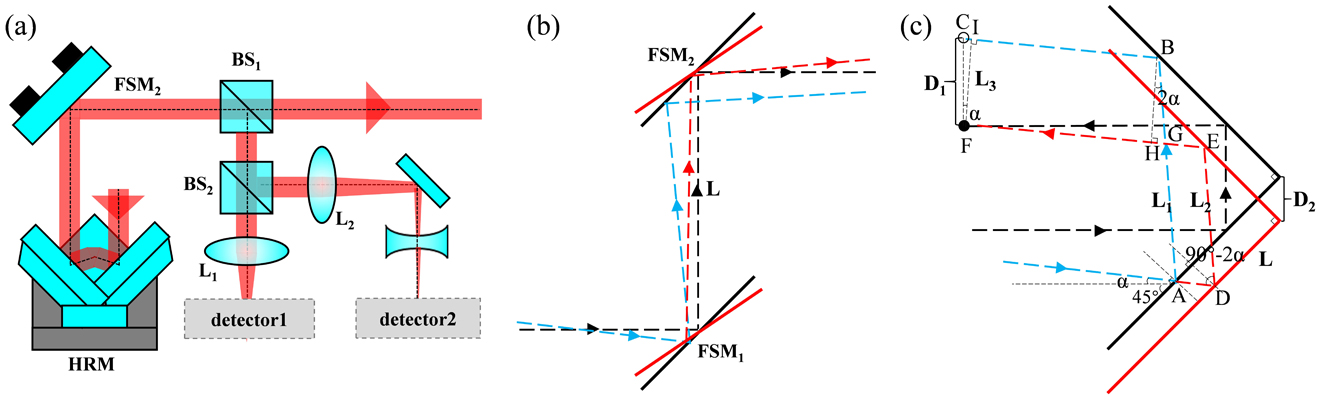
Figure 1.(a) Optical system based on error separation technique, (b) error analysis of improved calibration optical system, and (c) error analysis of optical system based on error separation technique. FSM, fast steering mirror; HRM, hollow retroreflector mirror; BS, beam splitter; L, lens.
The optical system consists of the control and detection units. The control unit contains a pair of fast steering mirrors (FSMs) to adjust the position and angular movements of the exit beam. The detection unit contains two detectors: one is to detect the positional deviation, and the other is to detect the angular deviation placed behind the lens. Because the focusing characteristic of the lens eliminates the influence of beam position movement, the detector can only detect the change of beam propagation angle.
This type of optical system is relatively simple, but its stability accuracy is affected by the following factors. First, the errors are caused by the coupling effect of piezoelectric devices, and an FSM with a piezo driver offers the advantages of small system dimensions, high accuracy, high bandwidth, and fast response[22,23]. However, the nonlinearity, hysteresis, and creep characteristics of piezoelectric actuators reduce the control accuracy. For the dual FSM control system, the coupling of errors will result in the failure to accurately calculate the error source, thus further reducing the control accuracy.
Second, the errors are caused by inaccurate correction calculations. The system requires the distance between the centers of the two FSMs when calculating the correction parameter values. However, when the incident beam deviates from the center of the first FSM, errors occur in the calculated correction values, which make it difficult to reach the expectation, as shown in Fig. 1(b). The black dotted line is the path of the beam under ideal conditions, the blue dotted line is the incident beam with both positional and angular beam deviations, and the red dotted line is the control result of the FSMs based on the beam deviations from detection units. It can be seen that there are errors in the feedback control.
Third, errors are caused by the detection mode of the angular deviation. The accuracy of angular detection is related to the focal length of the lens: the longer the focal length, the higher the accuracy. However, an increase in the optical path leads to an increase in instability, which results in a decrease in the detection accuracy. Therefore, it is difficult to improve the accuracy of the angle detection using ordinary lenses.
The optical structure was improved by considering the above factors. A lens was added in front of
The error separation technique can solve all of the problems mentioned above, and Fig. 1(c) shows the correction process using a hollow retroreflector mirror (HRM). The HRM uses three orthogonal surfaces to reflect light back to the source at the same angle as the incident beam. Unless the incident and reflected beams strike the center of the HRM, they will not overlap, but will instead be shifted with respect to each other, such that they are symmetrical about the center point where the three faces intersect. Therefore, the position of the reflected beam can be changed by shifting the HRM position.
According to the geometric relationship shown in Fig. 1(c), the following equations can be obtained:
By substituting Eqs. (3) and (4) into Eq. (2), the simplification is as follows:
According to Eq. (6), the distance the HRM moves is always half of the deviation value detected by the detector when the incident beam has positional and angular beam deviations. Thus, after correcting the HRM, the beam can be accurately incident into the center of
3. System Configuration and Alignment Principle
According to the principle introduced, the method for spatial alignment and stability of beams in a multi-beam system is presented in Fig. 2.
![]()
Figure 2.(a) Schematic of the spatial alignment and stability of multi-beam optical system: M, mirror; TS, translation stage; PSD, position sensitive detector. (b) Experimental setup of the optical system.
It consists of two modules for the stabilization of beams of different wavelengths, and the detection part of one module can detect different wavelengths at the same time to ensure the coincidence of the intensity centers of the two beams. Figure 2(a) shows the schematic of the double beams stabilization system, and Fig. 2(b) shows the experimental setup. Wavelengths of 780 and 532 nm were used in the system, which is consistent with that used in super-resolution imaging or super-resolution lithography.
The first laser beam (
When the system operates, the first laser beam is turned on, and position sensitive detectors,
The fluctuations can be classified into positional
![]()
Figure 3.Single-direction decoupled control results along (a) x, (b) y, (c) α, and (d) β directions of the first laser beam and (e) x, (f) y, (g) α, and (h) β directions of the second laser beam.
Based on these results, we can reach the following conclusions. First, the actual movement coincides well with the designed movement, which indicates the validity of the parameters and algorithm. Second, when one variable changes, the other three variables only change randomly and have nothing to do with the movement of this variable. This means that the system can achieve the regulation of a single variable that avoids errors caused by the coupling effect of piezoelectric devices. Third, the angular deviations of the laser beam are relatively large, which influences the accuracy of the angular correction. However, during the control process, the angular deviations become very small. Finally, the resolution of the detectors used for the first laser beam was smaller than that used for the second laser beam. High-precision detectors were chosen as common detectors to ensure that the two beams were centered, and detectors of a large range were chosen for the first laser beam to increase the adaptability and better align the centers of the two beams.
4. Experimental and Discussion
A scheme based on Fig. 2 was set up in our laboratory to evaluate the performance of the spatial alignment and stability of the multi-beam system. Vortex and solid distributions of the laser beams were selected to observe the coincidence of the beam centers. A CCD (MER-630-60U3C-L) and a lens (
![]()
Figure 4.(a) Photography of the test setup and (b) positional deviations of emitted laser beams detected by external detection. AVG, average.
To better align the centers of the two beams, the position and pointing of the first beam were adjusted through changing the locked positional and angular values. Initially, the positions of the two laser beams were detected, and then the second laser beam was blocked (black arrow), as shown in Fig. 4(b), where the positions of the first laser beam had nearly the same
To test the ability to avoid the errors caused by inaccurate correction calculations and the stability of the system, an active angular disturbance source was added to the first laser beam, as shown in Fig. 5. The detector placed approximately 30 cm from the system showed the results of beam deviation without feedback control [Fig. 5(a)]. The peak-to-valley (PV) value is approximately 30 µm, and the PV value becomes smaller than 1.5 µm with feedback control, as shown in Fig. 5(b).
![]()
Figure 5.Under-active disturbance: the results of the external detector (a) without and (b) with feedback for the first laser beam.
Figures 6 and 7 show the positional and angular deviations of the first laser beam and the second laser beam, respectively, detected by internal detectors over 1 h with feedback control. The stability of the beam was measured by the STD value, which evaluated the fluctuation of beam drift over much of the time. The deviations along the
![]()
Figure 6.Display of positional and angular deviations of the first laser beam (780 nm) over 1 h with feedback control. (a) Translational deviations, (b) and (c) deviations along the x and y directions over time, respectively, (d) angular deviations, and (e) and (f) deviations along the α and β directions over time, respectively.
![]()
Figure 7.Display of positional and angular deviations of the second laser beam (532 nm) over 1 h with feedback control. (a) Translational deviations, (b) and (c) deviations along the x and y directions over time, respectively, (d) angular deviations, and (e) and (f) deviations along the α and β directions over time, respectively.
The deviations in the
As for the second laser beam, the STD values were 0.03 and 0.04 µm for the positional deviations and 0.65 and 0.57 µrad for the angular deviations, as shown in Figs. 7(a)–7(f). The detection results were the same as those obtained for the first laser beam. Thus, the error separation technique has advantages for the spatial alignment and stability of beams in multi-beam systems, and the two beams can exit with the same beam center and high stability. With smaller resolution and lower noise of detectors, the spatial alignment and stability of multi-beam optical systems will achieve better performance.
Figure 8 shows the deviations of the incident beams and exit beams over 1 h with feedback control. Two PSDs were placed before our setup to directly detect the deviations before the beams entered the system. The X- and Y-axes drifts of the first laser beam and the second laser beam were over 20 µm, 10 µm and 30 µm, 20 µm, respectively. The laser beams passed through the system of spatial alignment and stability of beams, and a commercial optical beam profiler (DataRay, model: BC2-HR) was placed at the exit to verify the control results. The positional deviations of emitted beams are shown in Fig. 8(c), the sampling rate was 1 Hz, the X- and Y-axes drifts became less than 2 µm, and RMSs were 0.57 and 0.35 µm for
![]()
Figure 8.Deviations of incident laser beams: (a) the first laser beam, (b) the second laser beam, and (c) positional and (d) angular (f = 0.3 m) deviations of exit beams under control with an optical beam profiler.
For high-precision optical systems using an objective, angular deviations will have a more serious impact. A lens (
5. Conclusions
In conclusion, a new method for spatial alignment and stability of beams in a multi-beam system is presented. Compared to previous studies, the error separation technique has the advantage of avoiding alignment errors caused by the coupling effect of piezoelectric devices, inaccurate correction calculation, and detection mode of angular deviation. The spatial alignment and stability of the multi-beam optical system was built with a small size, and the experiments proved that the centers of the two beams overlapped. The average errors of center positions along the
References
[1] S. W. Hell, J. Wichmann. Breaking the diffraction resolution limit by stimulated emission: stimulated-emission-depletion fluorescence microscopy. Opt. Lett., 19, 780(1994).
[2] L. Li, R. R. Gattass, E. Gershgoren, H. Hwang, J. T. Fourkas. Achieving λ/20 resolution by one-color initiation and deactivation of polymerization. Science, 324, 910(2009).
[3] T. F. Scott, B. A. Kowalski, A. C. Sullivan, C. N. Bowman, R. R. Mcleod. Two-color single-photon photoinitiation and photoinhibition for subdiffraction photolithography. Science, 324, 913(2009).
[4] P. Müller, R. Müller, L. Hammer, C. Barner-Kowollik, M. Wegener, E. Blasco. STED-inspired laser lithography based on photoswitchable spirothiopyran moieties. Chem. Mater., 31, 1966(2019).
[5] E. Murtezi, S. Puthukodan, B. Buchegger, J. Jacak, T. A. Klar. STED controlled photobleaching for sub-diffractional optical nanopatterning. J. Phys. Photonics, 2, 044003(2020).
[6] J. Ma, X. Li, S. Yu, Q. Han. Influence of satellite vibration on optical communication performance for intersatellite laser links. Opt. Rev., 19, 25(2012).
[7] Q. Feng, B. Zhang, C. Kuang. A straightness measurement system using a single-mode fiber-coupled laser module. Opt. Laser. Technol., 36, 279(2004).
[8] M. A. Schwentker, H. Bock, M. Hofmann, S. Jakobs, J. Bewersdorf, C. Eggeling, S. W. Hell. Wide-field subdiffraction RESOLFT microscopy using fluorescent protein photoswitching. Microsc. Res. Tech., 70, 269(2007).
[9] T. J. Gould, D. Burke, J. Bewersdorf, M. J. Booth. Adaptive optics enables 3D STED microscopy in aberrating specimens. Opt. Express, 20, 20998(2012).
[10] T. J. Gould, E. B. Kromann, D. Burke, M. J. Booth, J. Bewersdorf. Auto-aligning stimulated emission depletion microscope using adaptive optics. Opt. Lett., 38, 1860(2013).
[11] T. Kanai, A. Suda, S. Bohman, M. Kaku, S. Yamaguchi, K. Midorikawa. Pointing stabilization of a high-repetition-rate high-power femtosecond laser for intense few-cycle pulse generation. Appl. Phys. Lett., 92, 061106(2008).
[12] J. Bao, L. Huang, A. Zeng, B. Ren, B. Yang, X. Peng, H. Huang. Study on beam stabilization technique in lithography illumination system. Chin. J. Lasers, 39, 0908004(2012).
[13] S. Liu, S. Tan, Y. Huang, K. C. Fan. Design of a compact four degree-of-freedom active compensation system to restrain laser’s angular drift and parallel drift. Rev. Sci. Instrum., 90, 115002(2019).
[14] M. Dobosz. Interference sensor for ultra-precision measurement of laser beam angular deflection. Rev. Sci. Instrum., 89, 115003(2018).
[15] B. G. Podlaskin, E. G. Guk, A. G. Obolenskov, A. A. Sukharev. Improvement of the accuracy of a position-sensitive detector with a wide field of view. Tech. Phys. Lett., 46, 988(2020).
[16] S. Chatterjee, Y. P. Kumar. Measurement of two-dimensional small angle deviation with a prism interferometer. Appl. Opt., 47, 4900(2008).
[17] Y. Huang, Y. Wang, C. Kuang, X. Liu. Method for enhancing stability in multi-beam microscopy. Meas. Sci. Technol., 27, 105901(2016).
[18] J. Wang, L. Huang, L. Hou, G. He, Q. Song, H. Huang. Study of active beam steering system with a simple method. Chin. Opt. Lett., 12, 081405(2014).
[19] F. Balzarotti, Y. Eilers, K. C. Gwosch, A. H. Gynna, V. Westphal, F. D. Stefani, S. Hell. Nanometer resolution imaging and tracking of fluorescent molecules with minimal photon fluxes. Science, 355, 606(2007).
[20] Z. Gan, Y. Cao, R. A. Evans, M. Gu. Three-dimensional deep sub-diffraction optical beam lithography with 9 nm feature size. Nat. Commun., 4, 2061(2013).
[21] C. Ding, D. Zhu, Z. Wei, M. Tang, C. F. Kuang, X. Liu. A compact and high-precision method for active beam stabilization system. Opt. Commun., 500, 127328(2021).
[22] S. Shao, Z. Tian, S. Song, M. Xu. Two-degrees-of-freedom piezo-driven fast steering mirror with cross-axis decoupling capability. Rev. Sci. Instrum., 89, 055003(2018).
[23] E. Csencsics, B. Sitz, G. Schitter. Integration of control design and system operation of a high performance piezo-actuated fast steering mirror. IEEE ASME Trans Mechatron., 25, 239(2019).


Set citation alerts for the article
Please enter your email address

© Copyright 2018-2021 | Chinese Laser Press. All Rights Reserved 沪ICP备15018463号-20