
Shuiqin Zheng, Zhenkuan Chen, Qinggang Lin, Yi Cai, Xiaowei Lu, Yanxia Gao, Shixiang Xu, Dianyuan Fan. High-gain amplification for femtosecond optical vortex with mode-control regenerative cavity[J]. Photonics Research, 2020, 8(8): 1375
- Photonics Research
- Vol. 8, Issue 8, 1375 (2020)
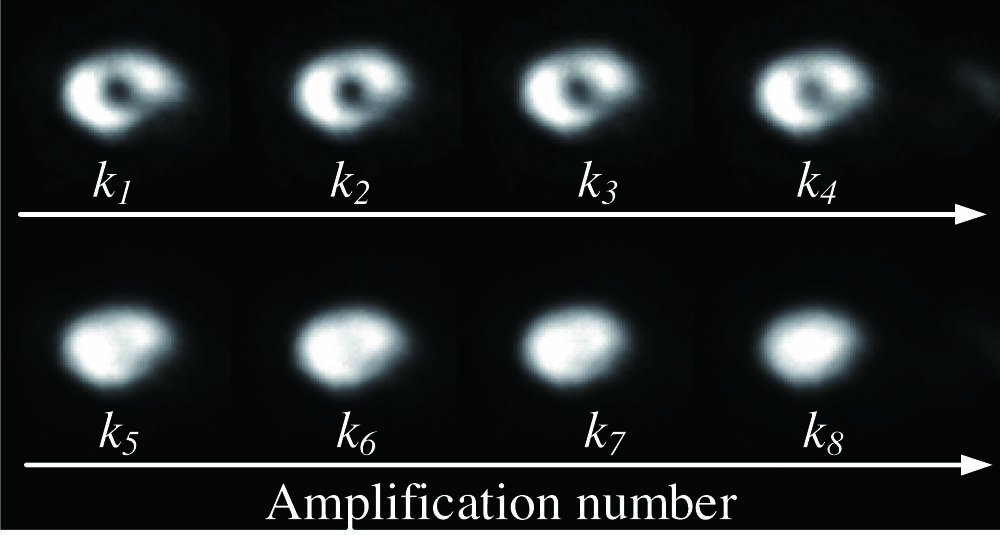
Fig. 1. Evolution of an optical vortex seed with l = 1 k n = 4 n − 3
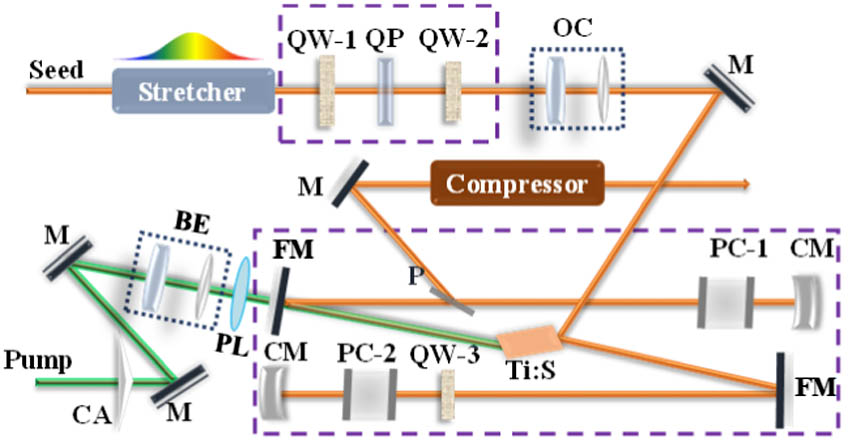
Fig. 2. Setup of the proposed RA. QW, quarter-wave plate; QP, Q-plate; OC, optical coupling system; M, plane mirror; CM, concave mirror, R = − 1 m R = 0.9 m f = 30 cm
Fig. 3. Simulations of laser oscillations from noises with the different ring-shaped pump radii. Expansion ratios are (a) 4, (b) 3.5, and (c) 3.
Fig. 4. Simulation of vortex amplification with different seed energies.
Fig. 5. (a) Ring-shaped pump on one of the Ti:S surfaces, (b) the donut-shaped output from the unseeded RA, (c) the phase structure of our Dammann vortex grating, (d) the corresponding far-field with parallel illumination, and (e) the measured far-field illuminated by the output of the unseeded RA.
Fig. 6. Recorded spatial intensities of the seed with l = 1
Fig. 7. Recorded spatial intensities of the seed with l = − 1
Fig. 8. (a) Spatial cross-section intensity of the amplified LG 0 , 1 LG 0 , 1 LG 0 , 1

Set citation alerts for the article
Please enter your email address
© Copyright 2018-2021 | Chinese Laser Press. All Rights Reserved 沪ICP备15018463号-20