
Yaobin Qiao, Xin Chen, Zhengyu Guo. Near-Infrared Optical Imaging Based on Time-Domain Photon Information[J]. Acta Optica Sinica, 2019, 39(4): 0412011
- Acta Optica Sinica
- Vol. 39, Issue 4, 0412011 (2019)
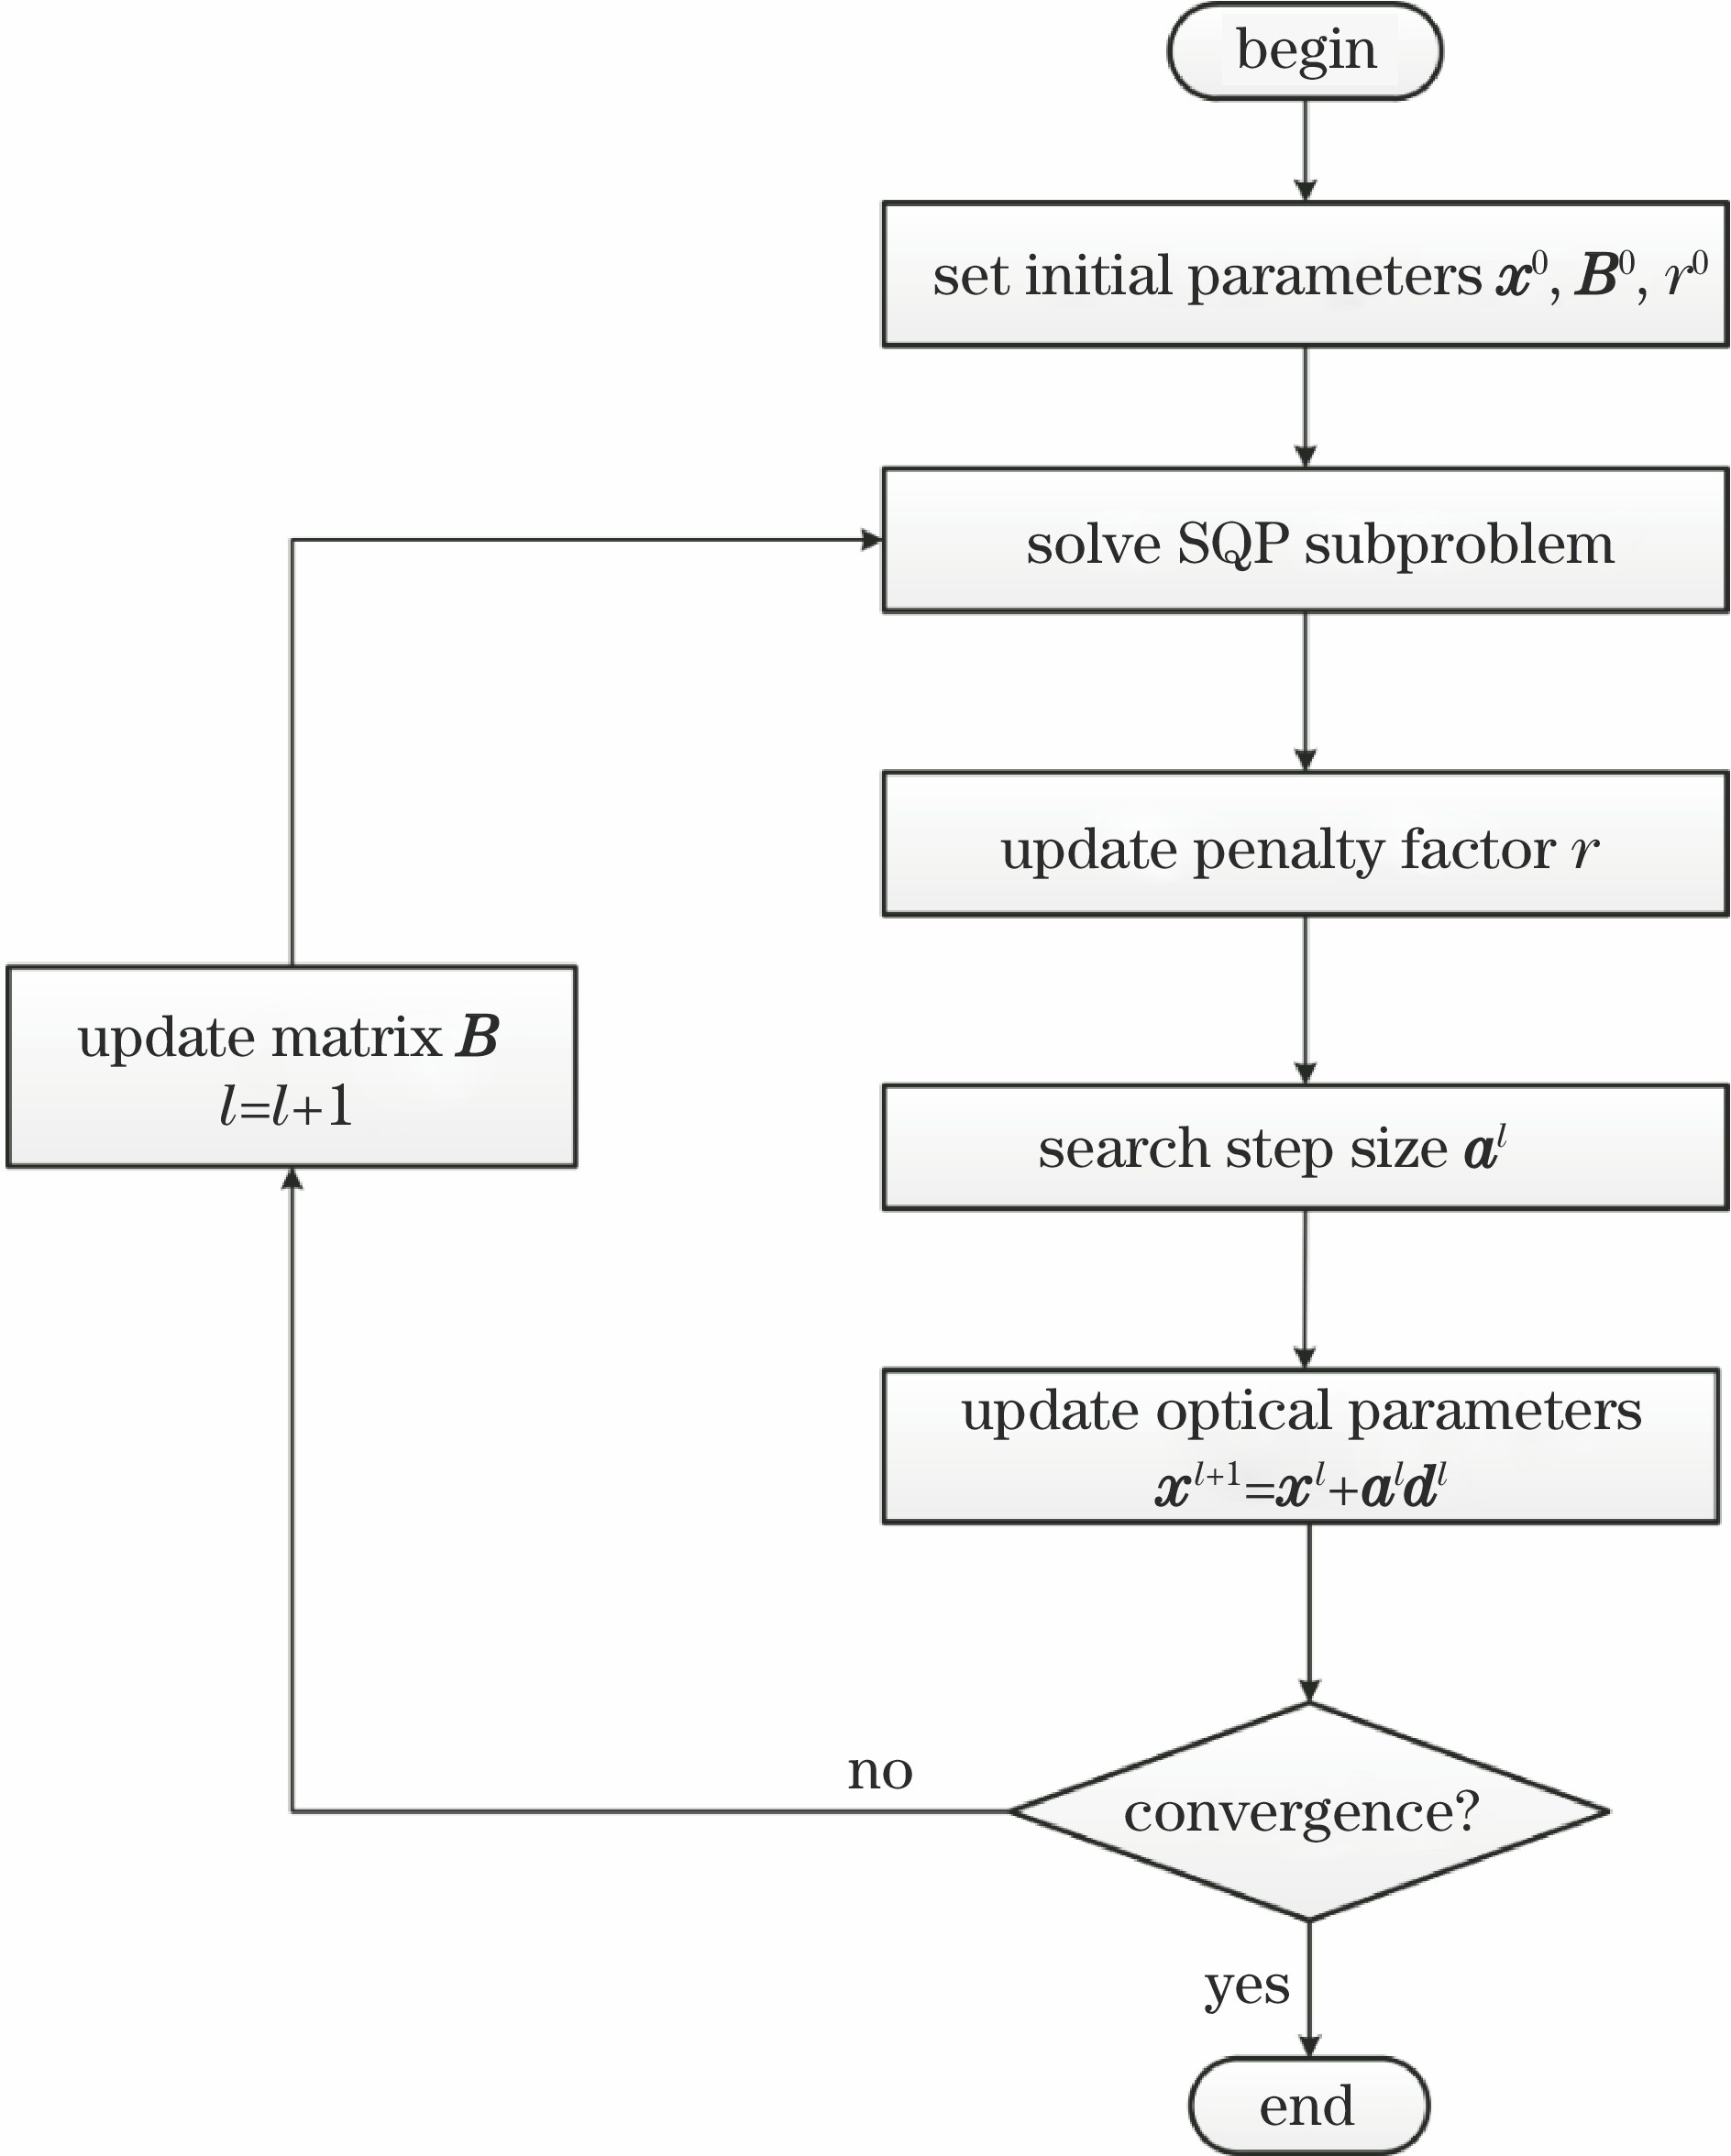
Fig. 1. Flow chart of SQP
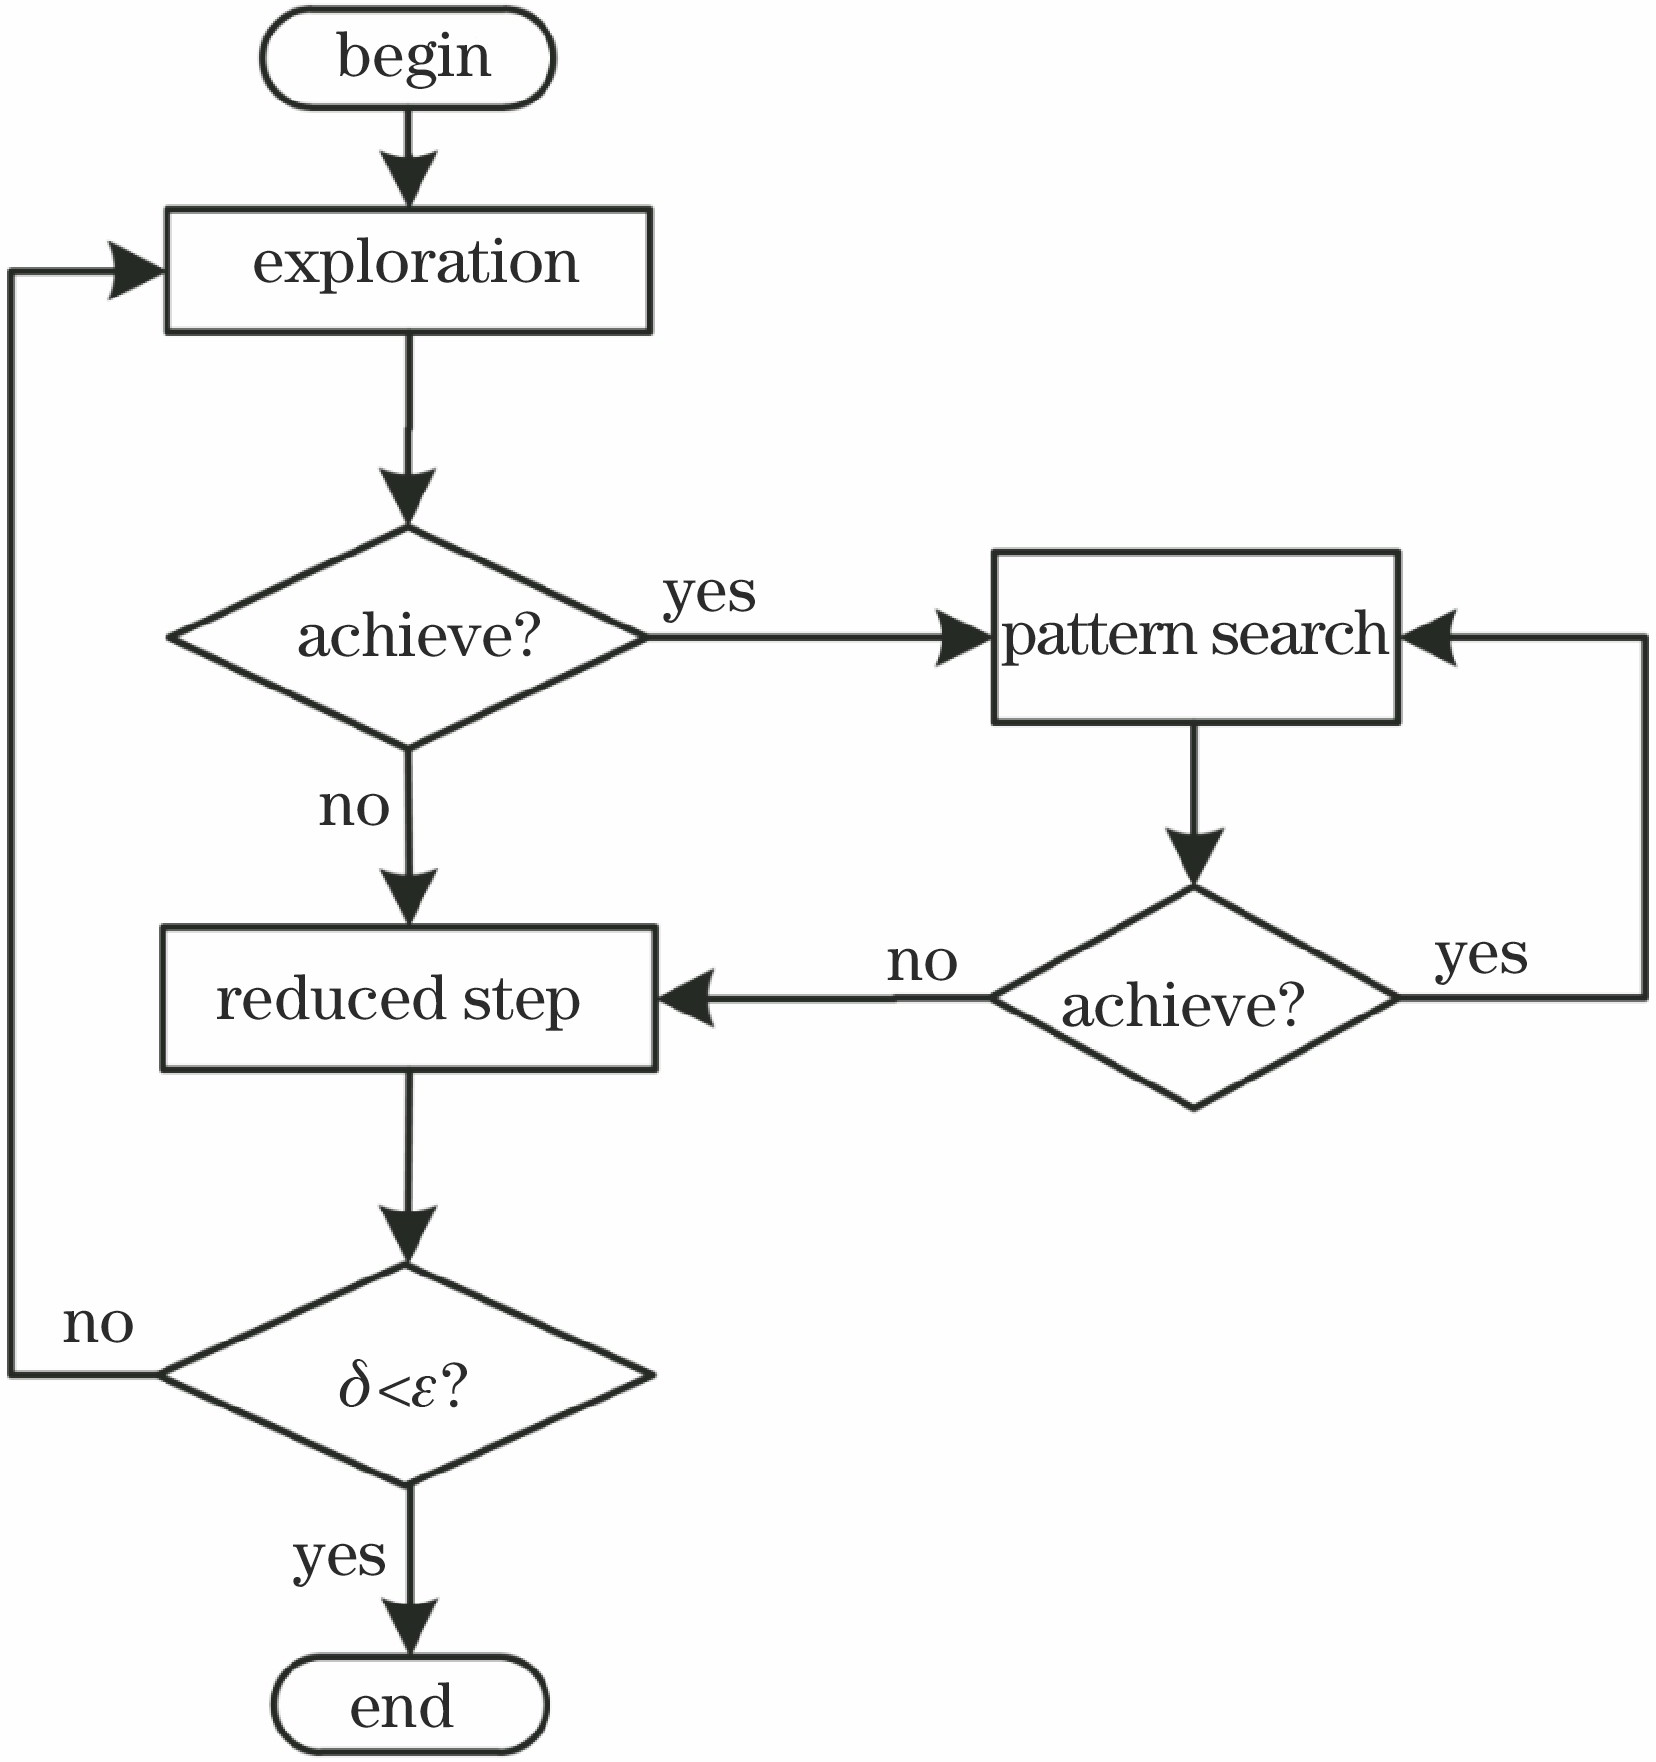
Fig. 2. Flow chart of step acceleration algorithm
Fig. 3. Time-domain infrared radiative signal measurement system based on TCSPC
Fig. 4. Principle diagram of time-domain infrared signal measurement
Fig. 5. Comparison of simulated signals and measured signals for phantoms. (a) Phantom 1; (b) phantom 2
Fig. 6. Influence of laser power on measured curve
Fig. 7. Model with fiber setup
Fig. 8. Reconstructed results of absorption coefficient and scattering coefficient. (a)(d) Without measurement error; (b)(e) with 3% measurement error; (c)(f) with 5% measurement error
Fig. 9. Medium models for simulating cancerous tissues. (a) Skin tissue; (b) liver tissue
Fig. 10. Reconstruction results of skin tissue containing tumour. (a) Absorption coefficient; (b) scattering coefficient
Fig. 11. Reconstruction results of liver tissue containing tumour. (a) Absorption coefficient; (b) scattering coefficient
|
Table 1. Real distributions of optical parameters in medium
|
Table 2. Choice of initial value
|
Table 3. ENRMSE of reconstruction results
| ||||||||||||||||||||
Table 4. Search results of step acceleration algorithm
| |||||||||||||||||||||||
Table 5. Absorption and scattering coefficients of human skin tissue[29] and liver tissue[30]

Set citation alerts for the article
Please enter your email address
© Copyright 2018-2021 | Chinese Laser Press. All Rights Reserved 沪ICP备15018463号-20