- Spectroscopy and Spectral Analysis
- Vol. 42, Issue 3, 821 (2022)
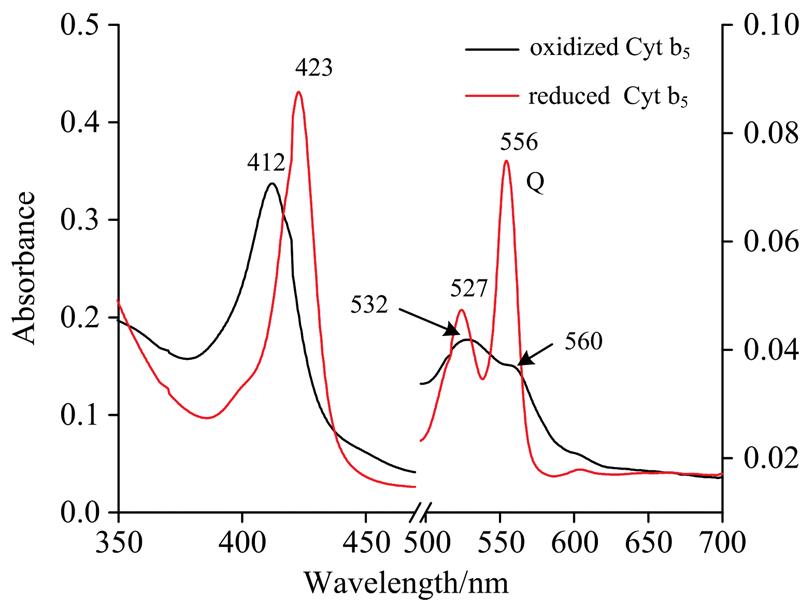
Fig. 1. Stationary absorption spectra of completely oxidized (black) and completely reduced (red) Cyt b5
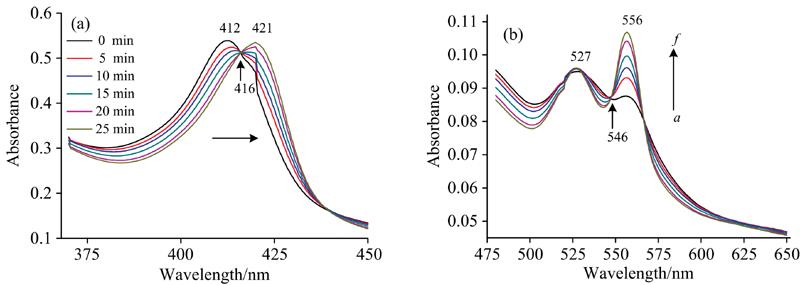
Fig. 2. UV-Vis absorption spectra of Cyt b5 with/without irradiation at 280 nm
(a): Before illumination; (b): Upon illuminationc cyt b5=5×10⁻⁶ mol·L-1
(a): Before illumination; (b): Upon illumination
Fig. 3. UV-Vis absorption spectra of chemical reduction for Cyt b5 with sodium dithionite
(a): The absorption spectra of chemical reduction for Cty b5 in soret band with sodium dithionite; (b): The obsorption spectra of chemical reduction for Cty b5 in Q band with sodium dithionitec cyt b5=3×10⁻⁶ mol·L-1, from a to e, c N a 2 S 2 O 4
(a): The absorption spectra of chemical reduction for Cty b5 in soret band with sodium dithionite; (b): The obsorption spectra of chemical reduction for Cty b5 in Q band with sodium dithionite
Fig. 4. UV-Vis absorbance change of Cyt b5 irradiated by xenon lamp at different fixed wavelengths
(a): 254 nm; (b): 280 nm; (c): 412 nm; (d): 423 nm
(a): 254 nm; (b): 280 nm; (c): 412 nm; (d): 423 nm
Fig. 5. Curve of irradiation reduction peak area of Cyt b5 solution under different pH conditions at 280 nm
(a): The peak area changes at 412 nm; (b): The peak area changes at 556 nm
(a): The peak area changes at 412 nm; (b): The peak area changes at 556 nm
Fig. 6. UV-Vis absorbance change of Cyt b5 added GSH under pH 7.4 a : Cyt b5; b : Cyt b5 irradiated at 25 min; c : Cyt b5-GSH irradiated at 25 min
Fig. 7. UV-Vis absorbance change of Cyt b5 added Met under pH 7.4 a : Cyt b5; b : in dark 30 min; c : Cyt b5 irradiated at 5 min; d : Cyt b5-Met irradiated at 5 min
Fig. 8. UV-Vis absorbance change of Cyt b5 added imidazole under pH 7.4
(a): The peak area changes at 412 nm; (b): Area changes at 556 nm
(a): The peak area changes at 412 nm; (b): Area changes at 556 nm
Fig. 9. Fluorescene spectra of Cyt b5 at different irradiated time at 280 nm Frome a to f , the irradiation times were 0, 5, 10, 15, 20, 25 min, respectively
Fig. 10. CD spectra of Cyt b5 after irradiation with xenon lamp at 280 nm From a to c , the irradiation times were 0, 10, 25 min, respectively

Download Citation

Set citation alerts for the article
Please enter your email address
© Copyright 2018-2021 | Chinese Laser Press. All Rights Reserved 沪ICP备15018463号-20