• Chinese Optics Letters
  • Vol. 20, Issue 1, 011702 (2022)
Sungchul Kim1, Evgenii Kim2, Eloise Anguluan1, and Jae Gwan Kim1、*
Author Affiliations
  • 1Department of Biomedical Science & Engineering, Institute of Integrated Technology, Gwangju Institute of Science and Technology (GIST), Gwangju 61005, Republic of Korea
  • 2Center for Bionics, Biomedical Research Institute, Korea Institute of Science and Technology (KIST), Seoul 02792, Republic of Korea
  • show less
    DOI: 10.3788/COL202220.011702 Cite this Article Set citation alerts
    Sungchul Kim, Evgenii Kim, Eloise Anguluan, Jae Gwan Kim. Sample entropy analysis of laser speckle fluctuations to suppress motion artifact on blood flow monitoring[J]. Chinese Optics Letters, 2022, 20(1): 011702 Copy Citation Text show less
    Schematic diagram of the SampEn calculation sequence for LSI images.
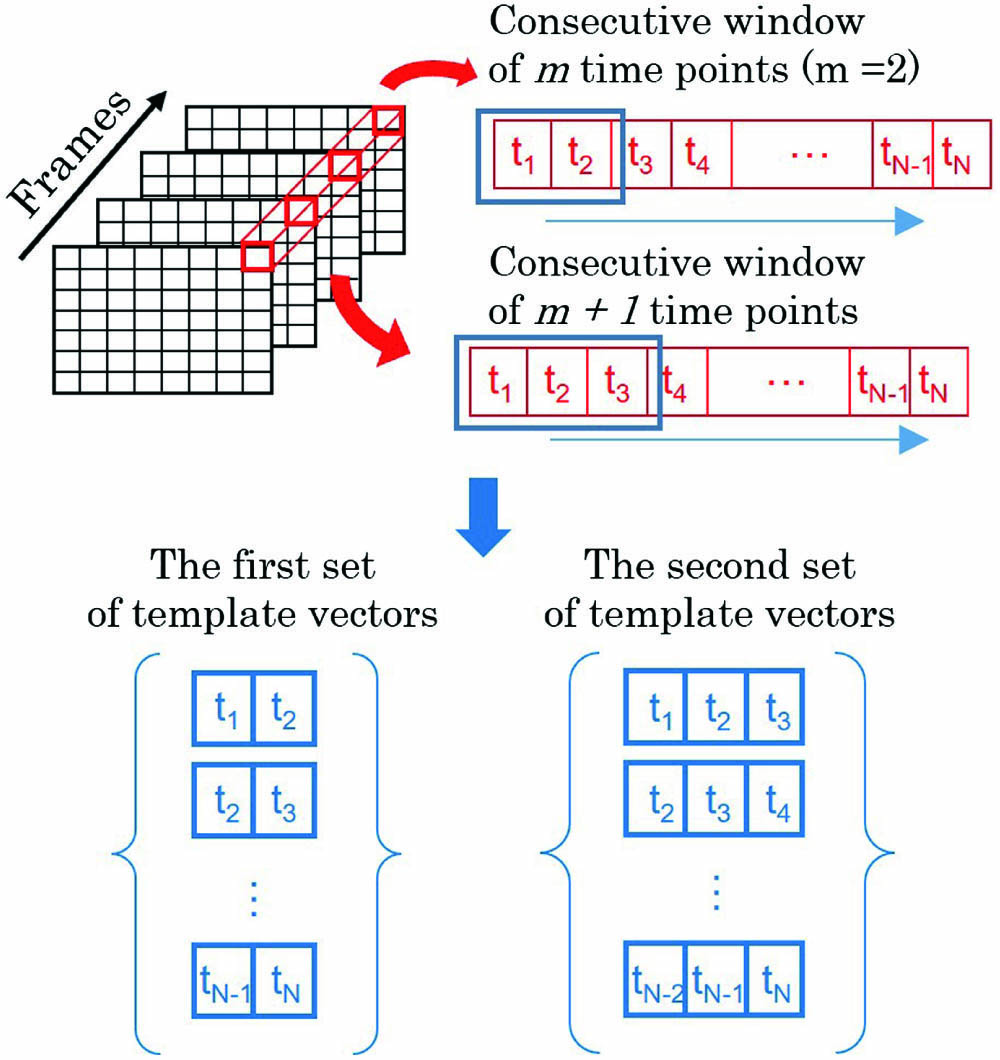
    Fig. 1. Schematic diagram of the SampEn calculation sequence for LSI images.
    Comparison of speckle contrast and SampEn calculations from phantom flow experiments. (a) Both σt and SampEn show a similar exponential decrease with increasing flow rate. (b) Incorporating the 〈I〉 in the calculation of speckle contrast (1/Kt2) and SampEn contrast (1/KSE2) results in a linear relationship with the rate of flow, as well as a greater range of values for SampEn contrast. (Each point is an average of 60 values taken over 1 min at a constant flow rate. Error bars indicate the standard deviation.)
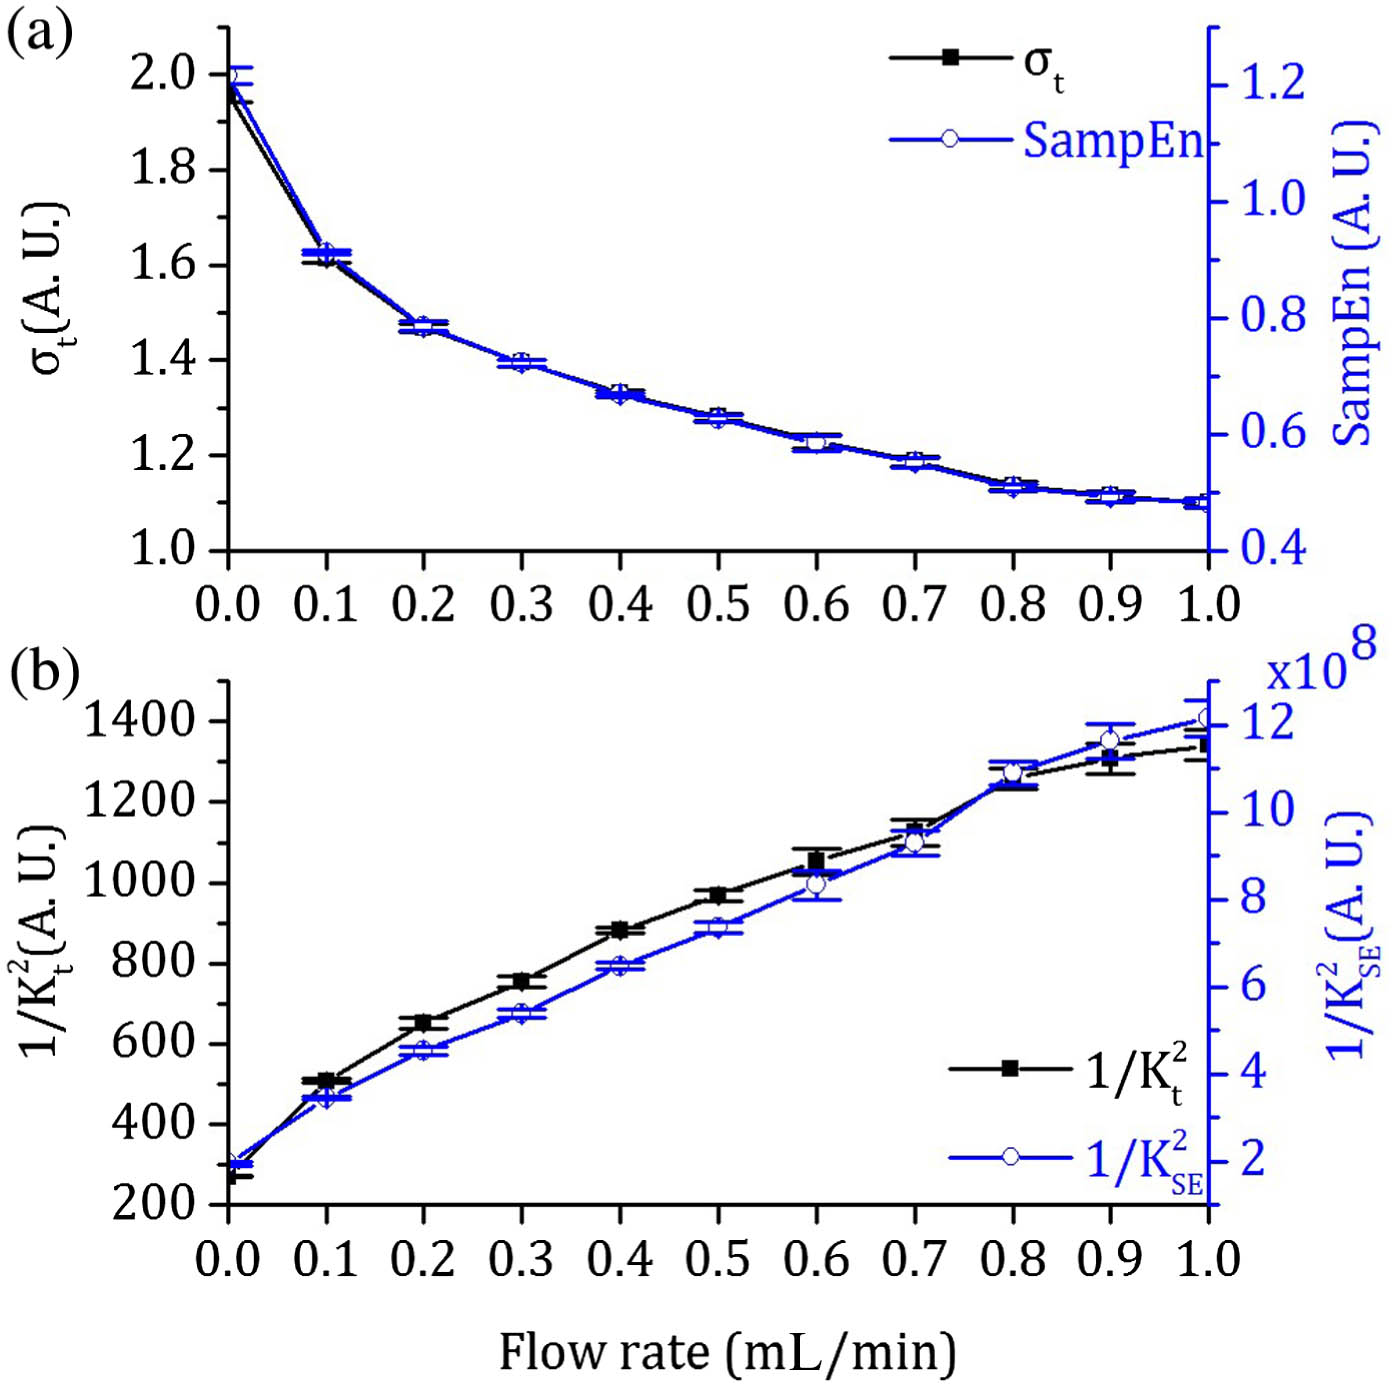
    Fig. 2. Comparison of speckle contrast and SampEn calculations from phantom flow experiments. (a) Both σt and SampEn show a similar exponential decrease with increasing flow rate. (b) Incorporating the 〈I〉 in the calculation of speckle contrast (1/Kt2) and SampEn contrast (1/KSE2) results in a linear relationship with the rate of flow, as well as a greater range of values for SampEn contrast. (Each point is an average of 60 values taken over 1 min at a constant flow rate. Error bars indicate the standard deviation.)
    (a) Normalized 1/KSE2 from flow phantom experiments depending on the various threshold values r. Threshold values were determined by multiples of the standard deviation of the first 65 recorded speckle intensity values where m is two. (b) The values of average and standard deviation of 1/KSE2 when the window length (m) changes from 2 to 4, where r is std*0.5.
    Fig. 3. (a) Normalized 1/KSE2 from flow phantom experiments depending on the various threshold values r. Threshold values were determined by multiples of the standard deviation of the first 65 recorded speckle intensity values where m is two. (b) The values of average and standard deviation of 1/KSE2 when the window length (m) changes from 2 to 4, where r is std*0.5.
    Representative blood flow maps during the baseline, arm occlusion, motion, overshooting period, and recovery. Blood flow maps are generated from 1/KSE2 (left) and 1/Kt2 (middle), and raw images are shown in the right column.
    Fig. 4. Representative blood flow maps during the baseline, arm occlusion, motion, overshooting period, and recovery. Blood flow maps are generated from 1/KSE2 (left) and 1/Kt2 (middle), and raw images are shown in the right column.
    Blood flow during arm occlusion accompanied by sudden hand movements from three different subjects (each row). The dashed region indicates the period of occlusion.
    Fig. 5. Blood flow during arm occlusion accompanied by sudden hand movements from three different subjects (each row). The dashed region indicates the period of occlusion.
    (a) Blood flow estimates using 1/KSE2 and post-processed 1/Kt2 with varying cutoff frequencies. (b) Magnified trace of the rapid blood flow change during cuff inflation. (c) Magnified trace of the motion artifact induced change. Traces were offset in the y axis to highlight the difference.
    Fig. 6. (a) Blood flow estimates using 1/KSE2 and post-processed 1/Kt2 with varying cutoff frequencies. (b) Magnified trace of the rapid blood flow change during cuff inflation. (c) Magnified trace of the motion artifact induced change. Traces were offset in the y axis to highlight the difference.
    Sungchul Kim, Evgenii Kim, Eloise Anguluan, Jae Gwan Kim. Sample entropy analysis of laser speckle fluctuations to suppress motion artifact on blood flow monitoring[J]. Chinese Optics Letters, 2022, 20(1): 011702
    Download Citation