• Chinese Optics Letters
  • Vol. 21, Issue 2, 020603 (2023)
Jian Luo, Haoran Wang, Xun Cai, Zhengqian Luo*, and Hongyan Fu**
Author Affiliations
  • Department of Electronic Engineering, School of Electronic Science and Engineering (National Model Microelectronics College), Xiamen University, Xiamen 361005, China
  • show less
    DOI: 10.3788/COL202321.020603 Cite this Article Set citation alerts
    Jian Luo, Haoran Wang, Xun Cai, Zhengqian Luo, Hongyan Fu. Temperature-sensing scheme based on a passively mode-locked fiber laser via beat frequency demodulation[J]. Chinese Optics Letters, 2023, 21(2): 020603 Copy Citation Text show less
    Experimental setup of the proposed temperature sensor utilizing a passively MLFL combined with the beat frequency demodulation system.
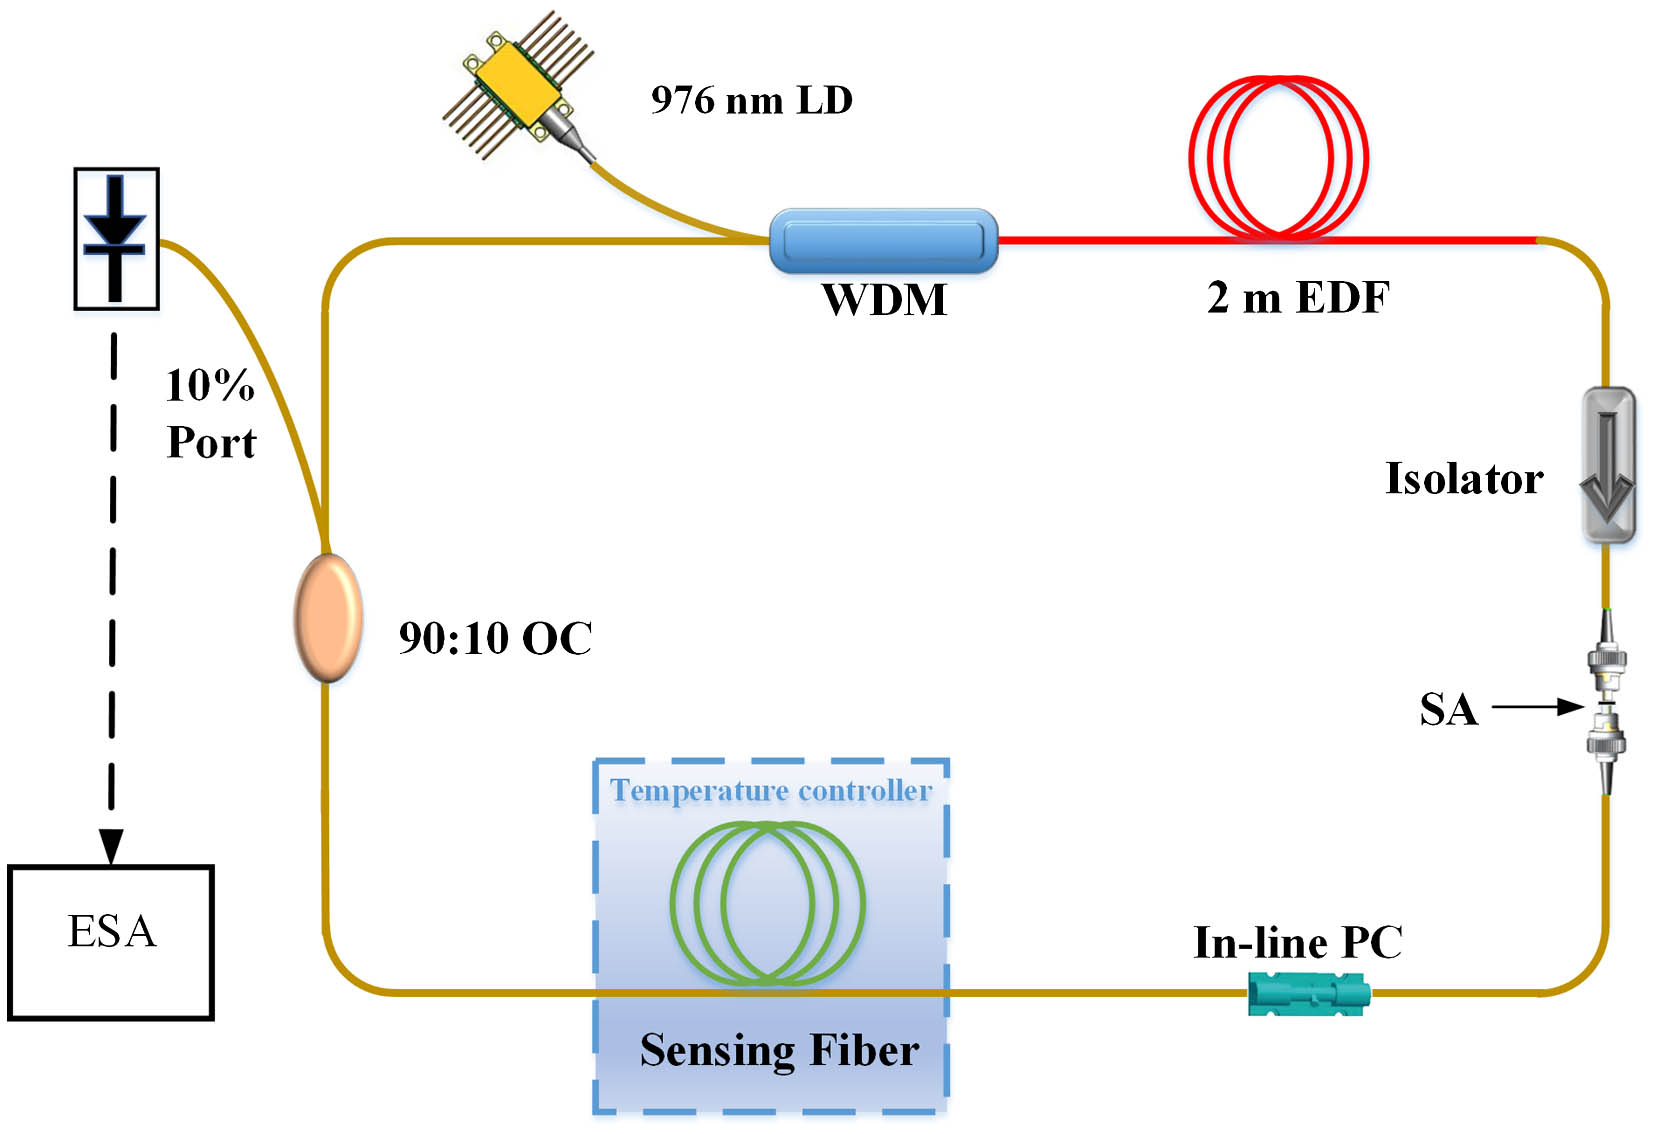
    Fig. 1. Experimental setup of the proposed temperature sensor utilizing a passively MLFL combined with the beat frequency demodulation system.
    Output characteristics of passively MLFL when the ratio of l to L is 5 m/12.5 m. (a) Optical spectrum; (b) pulse sequence; (c) autocorrelation curve; (d) RF spectrum.
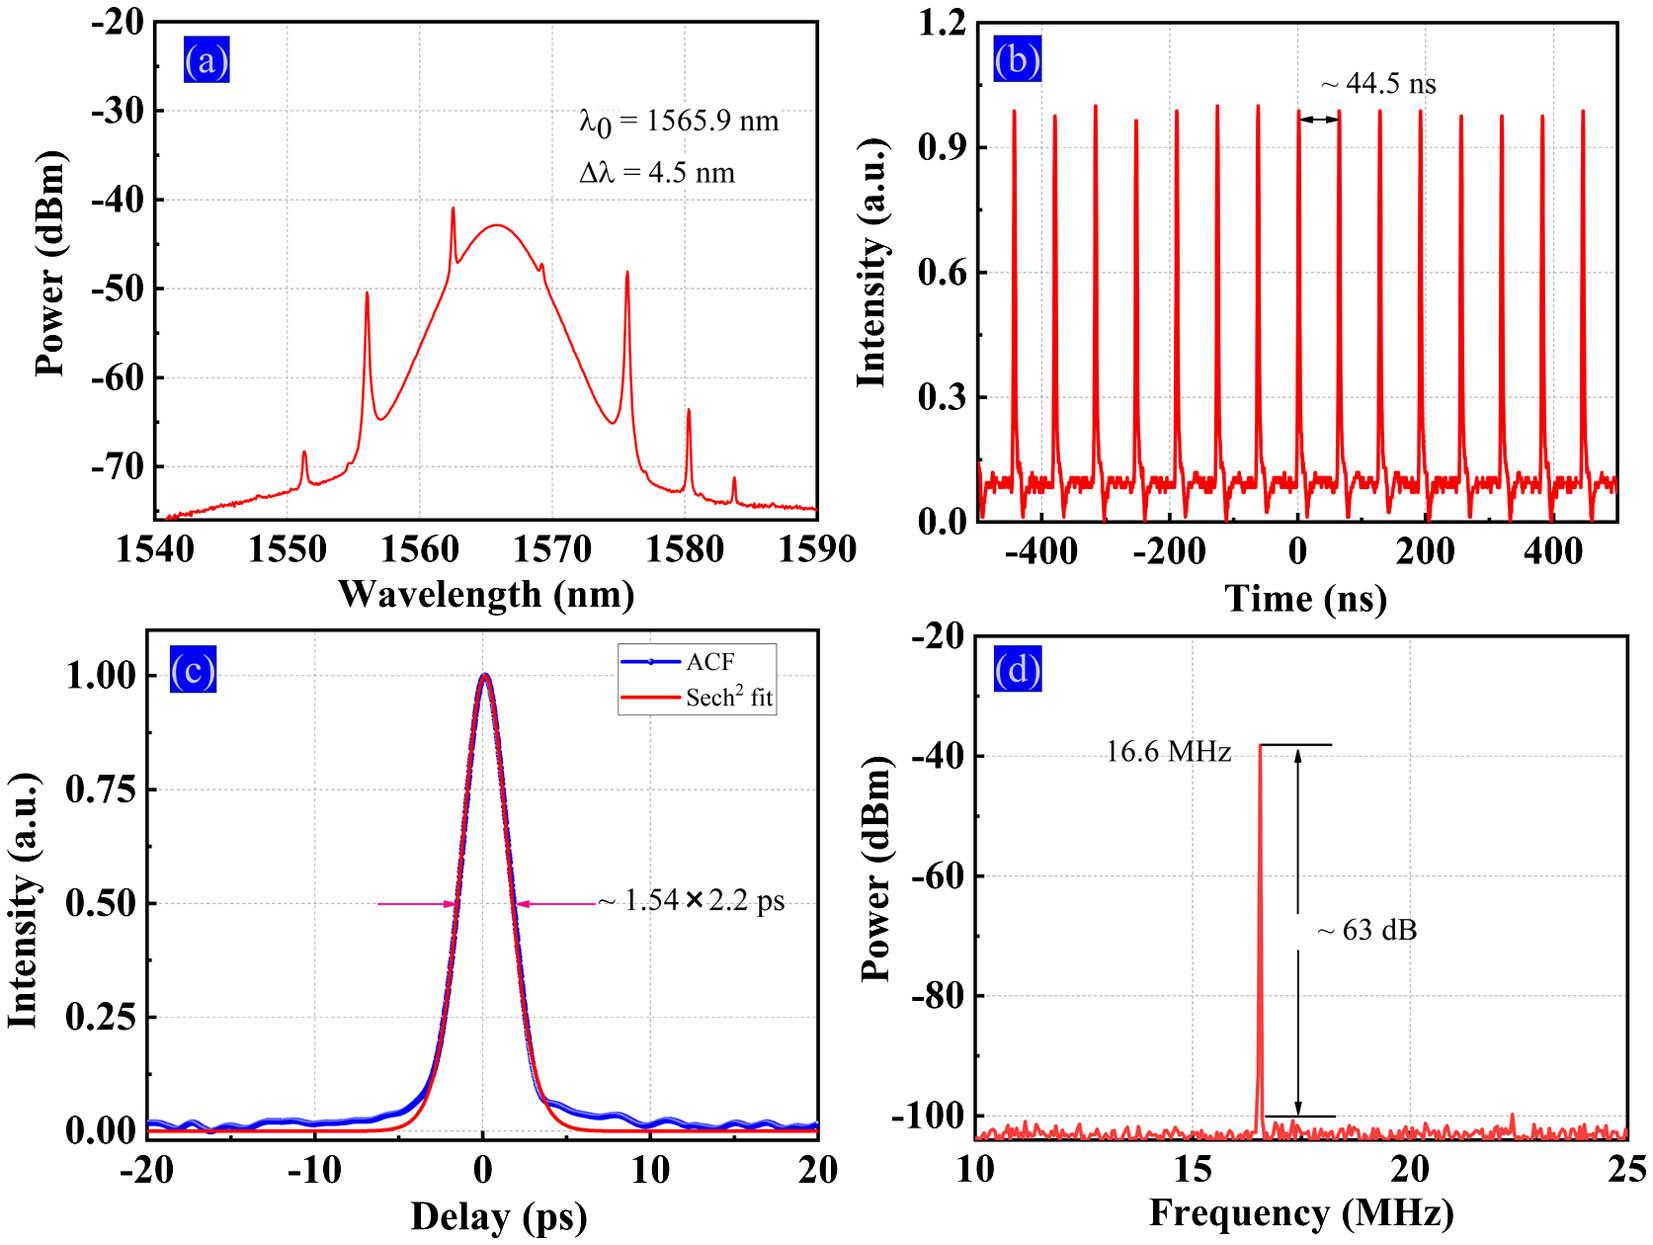
    Fig. 2. Output characteristics of passively MLFL when the ratio of l to L is 5 m/12.5 m. (a) Optical spectrum; (b) pulse sequence; (c) autocorrelation curve; (d) RF spectrum.
    (a) Measured repeated spectrum of the monitored BFS every 10 min for 50 min; (b) frequency stability of the monitored BFS at 5 GHz, 10 GHz, and 15 GHz, respectively.
    Fig. 3. (a) Measured repeated spectrum of the monitored BFS every 10 min for 50 min; (b) frequency stability of the monitored BFS at 5 GHz, 10 GHz, and 15 GHz, respectively.
    Measured spectra of BFS around (a) 5 GHz and (b) 15 GHz under different temperatures and the linear fit between the frequency shift and temperature around (c) 5 GHz and (d) 15 GHz when the ratio of l to L is set to 5 m/12.5 m, respectively.
    Fig. 4. Measured spectra of BFS around (a) 5 GHz and (b) 15 GHz under different temperatures and the linear fit between the frequency shift and temperature around (c) 5 GHz and (d) 15 GHz when the ratio of l to L is set to 5 m/12.5 m, respectively.
    Measured spectrum of the BFS around 10 GHz when the ratio of l to L is (a) 5 m/12.5 m and (b) 10 m/17.5 m, and (c) the response curve of the frequency shift to temperature variation.
    Fig. 5. Measured spectrum of the BFS around 10 GHz when the ratio of l to L is (a) 5 m/12.5 m and (b) 10 m/17.5 m, and (c) the response curve of the frequency shift to temperature variation.
    Ref.Sensing headTemperature rangeTemperature sensitivitySNR of the BFSDemodulation method
    [16]Sagnac interferometer21°C–50°C10.24 kHz/°C@1.58 GHz30dB@2GHzBeat frequency
    [27]Single-mode fiber30°C–220°C16.78 kHz/°C@4.04 GHz45dB@2GHzBeat frequency
    [28]EDF33°C–60°C5.2 kHz/°C@1.36 GHz40dB@1.36GHzBeat frequency
    [29]MZI20°C–32°C0.16 nm/°C/Wavelength
    [30]FBG15°C–60°C0.22 dB/°C/Intensity
    Our workSingle-mode fiber20°C–80°C44 kHz/°C@10GHz50dB@5GHzBeat frequency
    Table 1. Comparison with Various Optical Fiber Temperature Sensors
    Jian Luo, Haoran Wang, Xun Cai, Zhengqian Luo, Hongyan Fu. Temperature-sensing scheme based on a passively mode-locked fiber laser via beat frequency demodulation[J]. Chinese Optics Letters, 2023, 21(2): 020603
    Download Citation