• Advanced Photonics
  • Vol. 2, Issue 2, 026002 (2020)
Zi-xuan Ding1, Zi-nan Huang2, Ye Chen1, Cheng-bo Mou2、*, Yan-qing Lu1、*, and Fei Xu1、*
Author Affiliations
  • 1Nanjing University, College of Engineering and Applied Sciences, Nanjing, China
  • 2Shanghai University, Key Laboratory of Specialty Fiber Optics and Optical Access Networks Shanghai, Shanghai, China
  • show less
    DOI: 10.1117/1.AP.2.2.026002 Cite this Article Set citation alerts
    Zi-xuan Ding, Zi-nan Huang, Ye Chen, Cheng-bo Mou, Yan-qing Lu, Fei Xu. All-fiber ultrafast laser generating gigahertz-rate pulses based on a hybrid plasmonic microfiber resonator[J]. Advanced Photonics, 2020, 2(2): 026002 Copy Citation Text show less
    HPMKR design and characterization. (a) Schematic of the central component—a Q (∼104–105) microfiber ring resonator (with fiber pigtails) attached to gold film and coated with PDMS. Insets show the optical and SEM microscopic pictures of a typical sample that has a ring diameter of 1.1 mm and fiber diameter of 2.4 μm. The red scale bar represents 500 μm. (b), (c) Cross-section electric field modal distribution for a TE (LMM) and TM (HMM) polarized beam calculated using the finite element method. The scale bar represents 1.25 μm. Gold and microfiber are denoted in the plots and the ambience is PDMS. (d) Typical polarization dependent loss (PDL) of HPMKR at C-band. (e) Exemplary transmission spectra of HPMKR acquired by optical spectrum analyzer and theoretical calculations. The inset provides measurements of this sample’s Q-factor up to 7.9×10⁵.
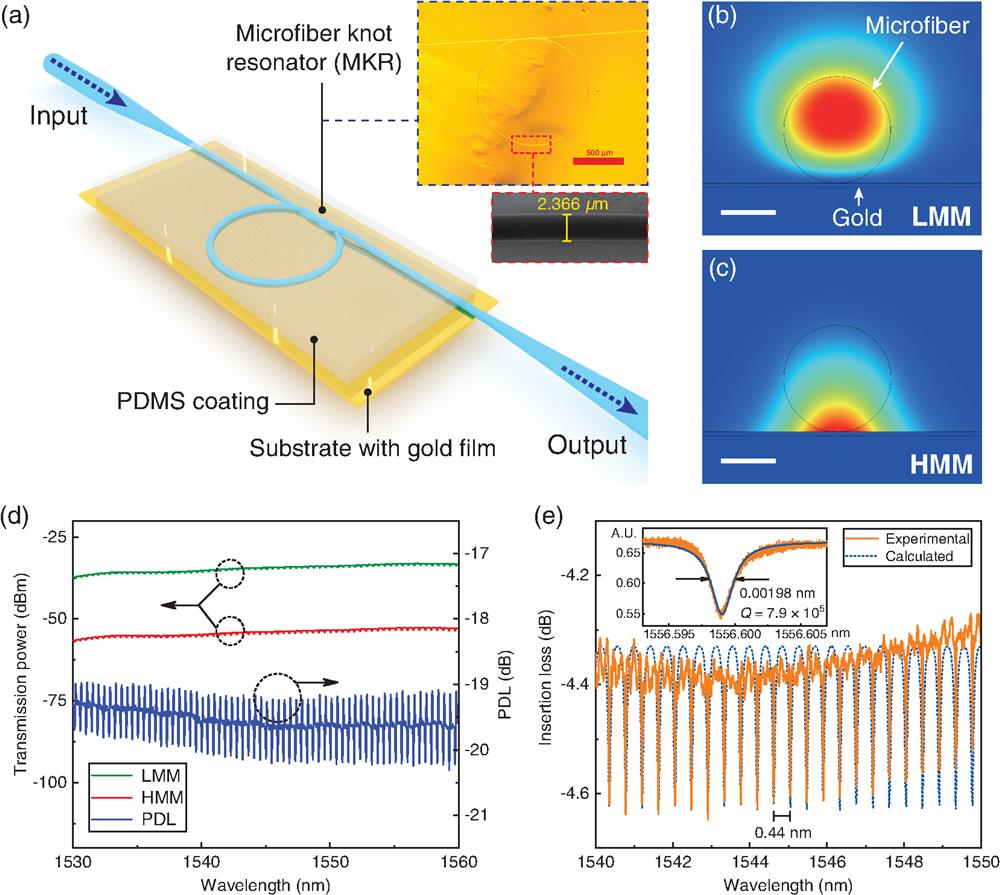
    Fig. 1. HPMKR design and characterization. (a) Schematic of the central component—a Q (104105) microfiber ring resonator (with fiber pigtails) attached to gold film and coated with PDMS. Insets show the optical and SEM microscopic pictures of a typical sample that has a ring diameter of 1.1 mm and fiber diameter of 2.4 μm. The red scale bar represents 500 μm. (b), (c) Cross-section electric field modal distribution for a TE (LMM) and TM (HMM) polarized beam calculated using the finite element method. The scale bar represents 1.25 μm. Gold and microfiber are denoted in the plots and the ambience is PDMS. (d) Typical polarization dependent loss (PDL) of HPMKR at C-band. (e) Exemplary transmission spectra of HPMKR acquired by optical spectrum analyzer and theoretical calculations. The inset provides measurements of this sample’s Q-factor up to 7.9×10⁵.
    Schematic of the fiber laser based on HPMKR. The HPMKR sample in Fig. 1(e) is embedded in a loop cavity containing a wavelength division multiplexer (WDM), erbium-doped-fiber (EDF), and polarization-independent isolator (PI-ISO) to force the unidirectional operation, and two polarization controllers to act on the pulse polarization. Furthermore, 20% of the optical waveform was extracted by an 80:20 optical coupler (OC) out of the cavity and monitored by an autocorrelator, optical spectrum analyzer (OSA), and photodetector connected with an oscilloscope, as well as an RF spectrum analyzer (RSA).
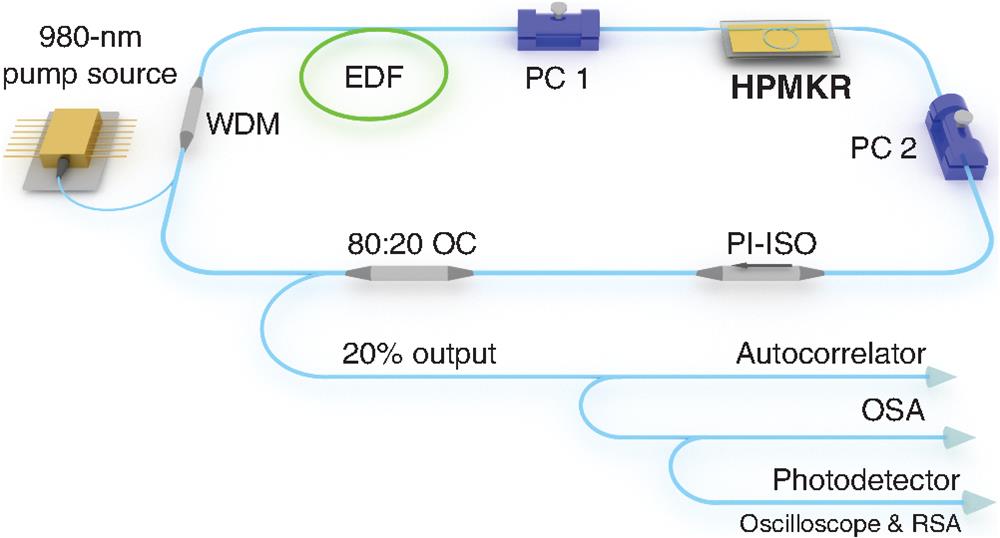
    Fig. 2. Schematic of the fiber laser based on HPMKR. The HPMKR sample in Fig. 1(e) is embedded in a loop cavity containing a wavelength division multiplexer (WDM), erbium-doped-fiber (EDF), and polarization-independent isolator (PI-ISO) to force the unidirectional operation, and two polarization controllers to act on the pulse polarization. Furthermore, 20% of the optical waveform was extracted by an 80:20 optical coupler (OC) out of the cavity and monitored by an autocorrelator, optical spectrum analyzer (OSA), and photodetector connected with an oscilloscope, as well as an RF spectrum analyzer (RSA).
    Evolution process of NPR-stimulated DFWM operation. Panel series (a)–(c) shows the experimental optical spectra, oscilloscope traces, and autocorrelation traces of the laser output, respectively, for different positions of PCs. To distinguish different working states, we describe each state by the operation regime of oscilloscope traces. (a)–(c) Q-switched operation. (a-1)–(c-1) Q-switched mode-locking operation where DFWM mode-locking emerged. (a-2)–(c-2) Mode-locking operation, the laser cavity modes were mode-locked by NPR while the HPMKR modes were mode-locked by DFWM.
    Fig. 3. Evolution process of NPR-stimulated DFWM operation. Panel series (a)–(c) shows the experimental optical spectra, oscilloscope traces, and autocorrelation traces of the laser output, respectively, for different positions of PCs. To distinguish different working states, we describe each state by the operation regime of oscilloscope traces. (a)–(c) Q-switched operation. (a-1)–(c-1) Q-switched mode-locking operation where DFWM mode-locking emerged. (a-2)–(c-2) Mode-locking operation, the laser cavity modes were mode-locked by NPR while the HPMKR modes were mode-locked by DFWM.
    High-repetition-rate pulse output with different repetition rates. (a)–(d) Optical spectra of HPMKR laser with FSR-varied samples. The corresponding autocorrelation traces are demonstrated in (e)–(h).
    Fig. 4. High-repetition-rate pulse output with different repetition rates. (a)–(d) Optical spectra of HPMKR laser with FSR-varied samples. The corresponding autocorrelation traces are demonstrated in (e)–(h).
    Laser output of comparative experiments. (a), (b) Output performances of a typical laser based on HPMKR. From top to bottom: the autocorrelation trace, optical spectra, oscilloscope trace, and RF spectra. The inset of the RF spectra is the spectrum under large scale. (c), (d) Output of laser with MKR and PD-ISO; the inset of optical spectra shows the MKR’s transmission spectra. (e), (f) Output of laser with only MKR and PI-ISO (has no polarizing feature). (g), (h) Output of laser with MZI (has minimal nonlinearity) and PD-ISO. Inset of optical spectra shows the transmission spectra of MZI.
    Fig. 5. Laser output of comparative experiments. (a), (b) Output performances of a typical laser based on HPMKR. From top to bottom: the autocorrelation trace, optical spectra, oscilloscope trace, and RF spectra. The inset of the RF spectra is the spectrum under large scale. (c), (d) Output of laser with MKR and PD-ISO; the inset of optical spectra shows the MKR’s transmission spectra. (e), (f) Output of laser with only MKR and PI-ISO (has no polarizing feature). (g), (h) Output of laser with MZI (has minimal nonlinearity) and PD-ISO. Inset of optical spectra shows the transmission spectra of MZI.
    NPR mode-locked soliton output of HPMKR laser at low intracavity power. (a) Optical spectrum; (b) autocorrelation trace. The cavity is the same structure as Fig. 2, containing 0.55-m EDF and 12.21-m SMF, corresponding to a net dispersion of −0.245 ps2 and longitudinal mode-spacing of 16.2 MHz.
    Fig. 6. NPR mode-locked soliton output of HPMKR laser at low intracavity power. (a) Optical spectrum; (b) autocorrelation trace. The cavity is the same structure as Fig. 2, containing 0.55-m EDF and 12.21-m SMF, corresponding to a net dispersion of 0.245  ps2 and longitudinal mode-spacing of 16.2 MHz.
    Simulation of microfiber’s optical parameters. (a) GVD of PDMS cladding microfiber of different diameters; (b) nonlinear parameter of PDMS cladding microfiber of different diameters.
    Fig. 7. Simulation of microfiber’s optical parameters. (a) GVD of PDMS cladding microfiber of different diameters; (b) nonlinear parameter of PDMS cladding microfiber of different diameters.
    Zi-xuan Ding, Zi-nan Huang, Ye Chen, Cheng-bo Mou, Yan-qing Lu, Fei Xu. All-fiber ultrafast laser generating gigahertz-rate pulses based on a hybrid plasmonic microfiber resonator[J]. Advanced Photonics, 2020, 2(2): 026002
    Download Citation