
Jian Tang, Yi Huang, Chuanlu Deng, Chengyong Hu, Qi Zhang, Jinlong Li, Xiaobei Zhang, Tingyun Wang. Design of Objective Lens and Realization of Monitoring System Based on Fiber Bundles[J]. Laser & Optoelectronics Progress, 2023, 60(7): 0722001
- Laser & Optoelectronics Progress
- Vol. 60, Issue 7, 0722001 (2023)
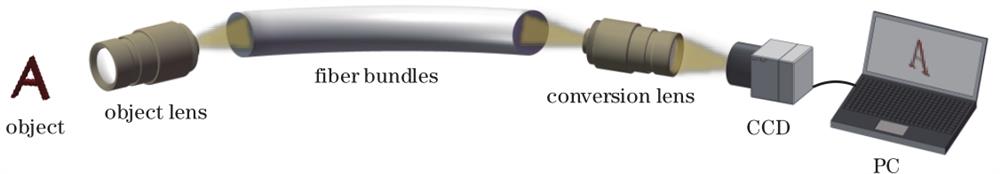
Fig. 1. Schematic diagram of the fiber bundles monitoring system
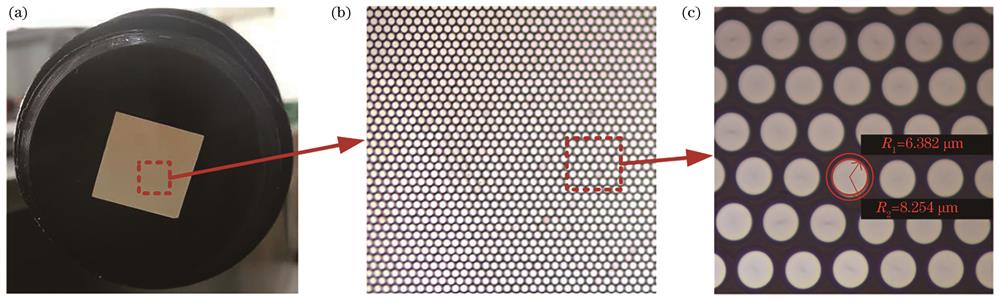
Fig. 2. Fiber bundles of rectangular cross-section. (a) End face of fiber bundles; (b) one hundred×under microscope enlarged image of fiber bundle end face observed; (c) five hundred×under microscope enlarged image of fiber bundle end face observed
Fig. 3. Optical path structure of objective lens
Fig. 4. Evaluation index of objective lens. (a) MTF curve; (b) relative illumination curve; (c) chromatic focal curve; (d) encircled energy curve; (e) geometric spot diagrams
Fig. 5. Interior structure and physical diagram of objective lens. (a) Sectional view; (b) physical diagram
Fig. 6. Relative illumination test and CRA curve. (a) Relative illumination test curve; (b) CRA curve
Fig. 7. Comparison diagrams of MTF simulation and test. (a) 0°; (b) 12°; (c) 25.5°; (d) 38.7°
Fig. 8. Construction of fiber bundles monitoring system. (a) Fiber bundles monitoring system; (b) front imaging module; (c) post conversion module
Fig. 9. Test result of fiber bundles monitoring system. (a) Vector graph of test card; (b) resulting image of system; (c) test image of TV line; (d) pixelated image; (e) depixelated image
Fig. 10. Radiated immunity test. (a) Horn antenna; (b) without interference transmission; (c) with interference transmission
|
Table 1. Design requirements of objective lens
|
Table 2. Structural parameters of objective lens
|
Table 3. Objective lens tolerance distribution
|
Table 4. Distribution of MTF probability
|
Table 5. Comparison of image evaluation index

Set citation alerts for the article
Please enter your email address
© Copyright 2018-2021 | Chinese Laser Press. All Rights Reserved 沪ICP备15018463号-20