
Yanli Li, Ruofeng Xu. No-Reference Image Quality Assessment of DIBR-Synthesized Images Based on Statistical Characteristics[J]. Laser & Optoelectronics Progress, 2022, 59(8): 0811001
- Laser & Optoelectronics Progress
- Vol. 59, Issue 8, 0811001 (2022)
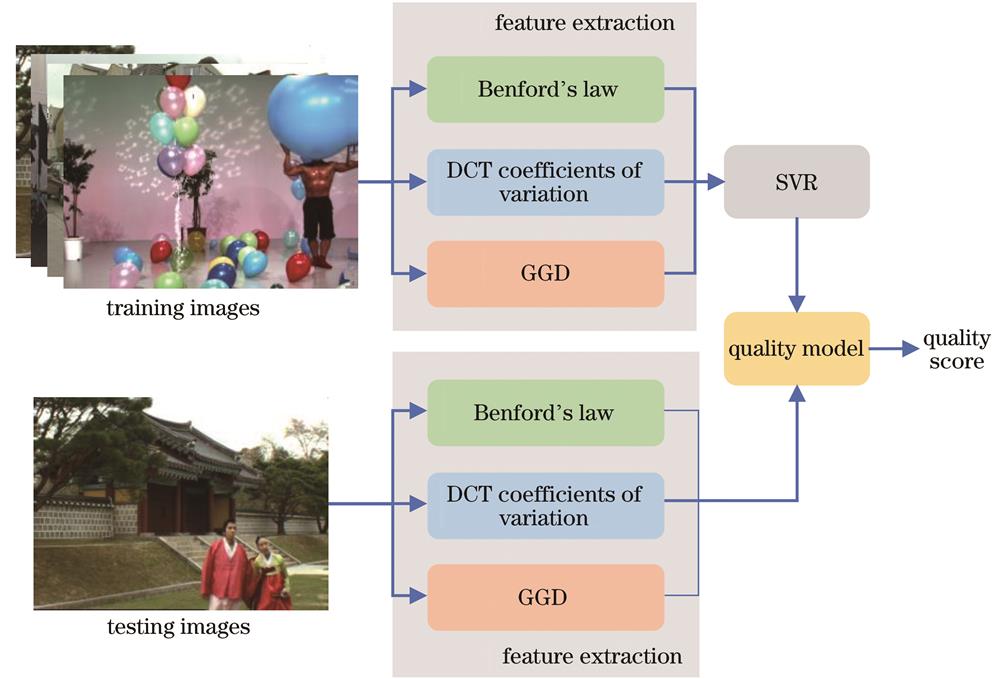
Fig. 1. Overview of the proposed method
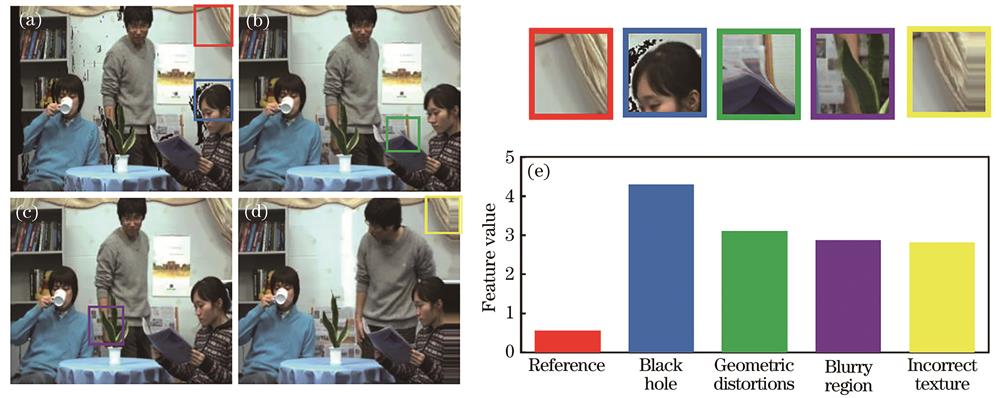
Fig. 2. Texture distortion blocks of DIBR image and corresponding Benford’s law feature values. (a) Reference block and black hole block; (b) geometric distortion block; (c) blurry block; (d) incorrect texture block; (e) corresponding feature value
Fig. 3. Traditional images with different distortion levels and corresponding Benford’s law feature values. (a) First-level Gaussian blur; (b) second-level Gaussian blur; (c) third-level Gaussian blur; (d) fourth-level Gaussian blur; (e) feature values extracted from six traditional images with different distortion levels
Fig. 4. The first digit probability of DCT coefficients of images with different quality
Fig. 5. DCT coefficients divided along the three directions of 45°, 90°, and 135°
Fig. 6. MSCN coefficients with different distortion
Fig. 7. Result of different training ratios
Fig. 8. Results of different distortion types and different sequences. (a) Results of six conventional distorted images; (b) results of nine sequences of images
|
Table 1. Information of databases used in the experiments
| ||||||||||||||||||||||||||||||||||||||||||||||||||||||||||||||||||||||||||||||||||||||||||||||||||||||||||||||||||||||||||||||||||||||||||||||||||||||||||||||||||||||||||||||||||||||||
Table 2. Comparison of different algorithms on three datasets
| |||||||||||||||||||||||||||||||||||||||||||||||||||||||||||
Table 3. Separate experiment of three features

Set citation alerts for the article
Please enter your email address
© Copyright 2018-2021 | Chinese Laser Press. All Rights Reserved 沪ICP备15018463号-20