• Acta Optica Sinica
  • Vol. 37, Issue 12, 1230001 (2017)
Dongsheng Qu, Yanji Hong*, Guangyu Wang, and Mingdong Wang
Author Affiliations
  • State Key Laboratory of Laser Propulsion & Application, Space Engineering University, Beijing 101416, China
  • show less
    DOI: 10.3788/AOS201737.1230001 Cite this Article Set citation alerts
    Dongsheng Qu, Yanji Hong, Guangyu Wang, Mingdong Wang. Measurement Method for Gas Parameters in Combustion Flow Based on Spectroscopy Fitting[J]. Acta Optica Sinica, 2017, 37(12): 1230001 Copy Citation Text show less
    Fitting flow chart for harmonic signal based on WMS
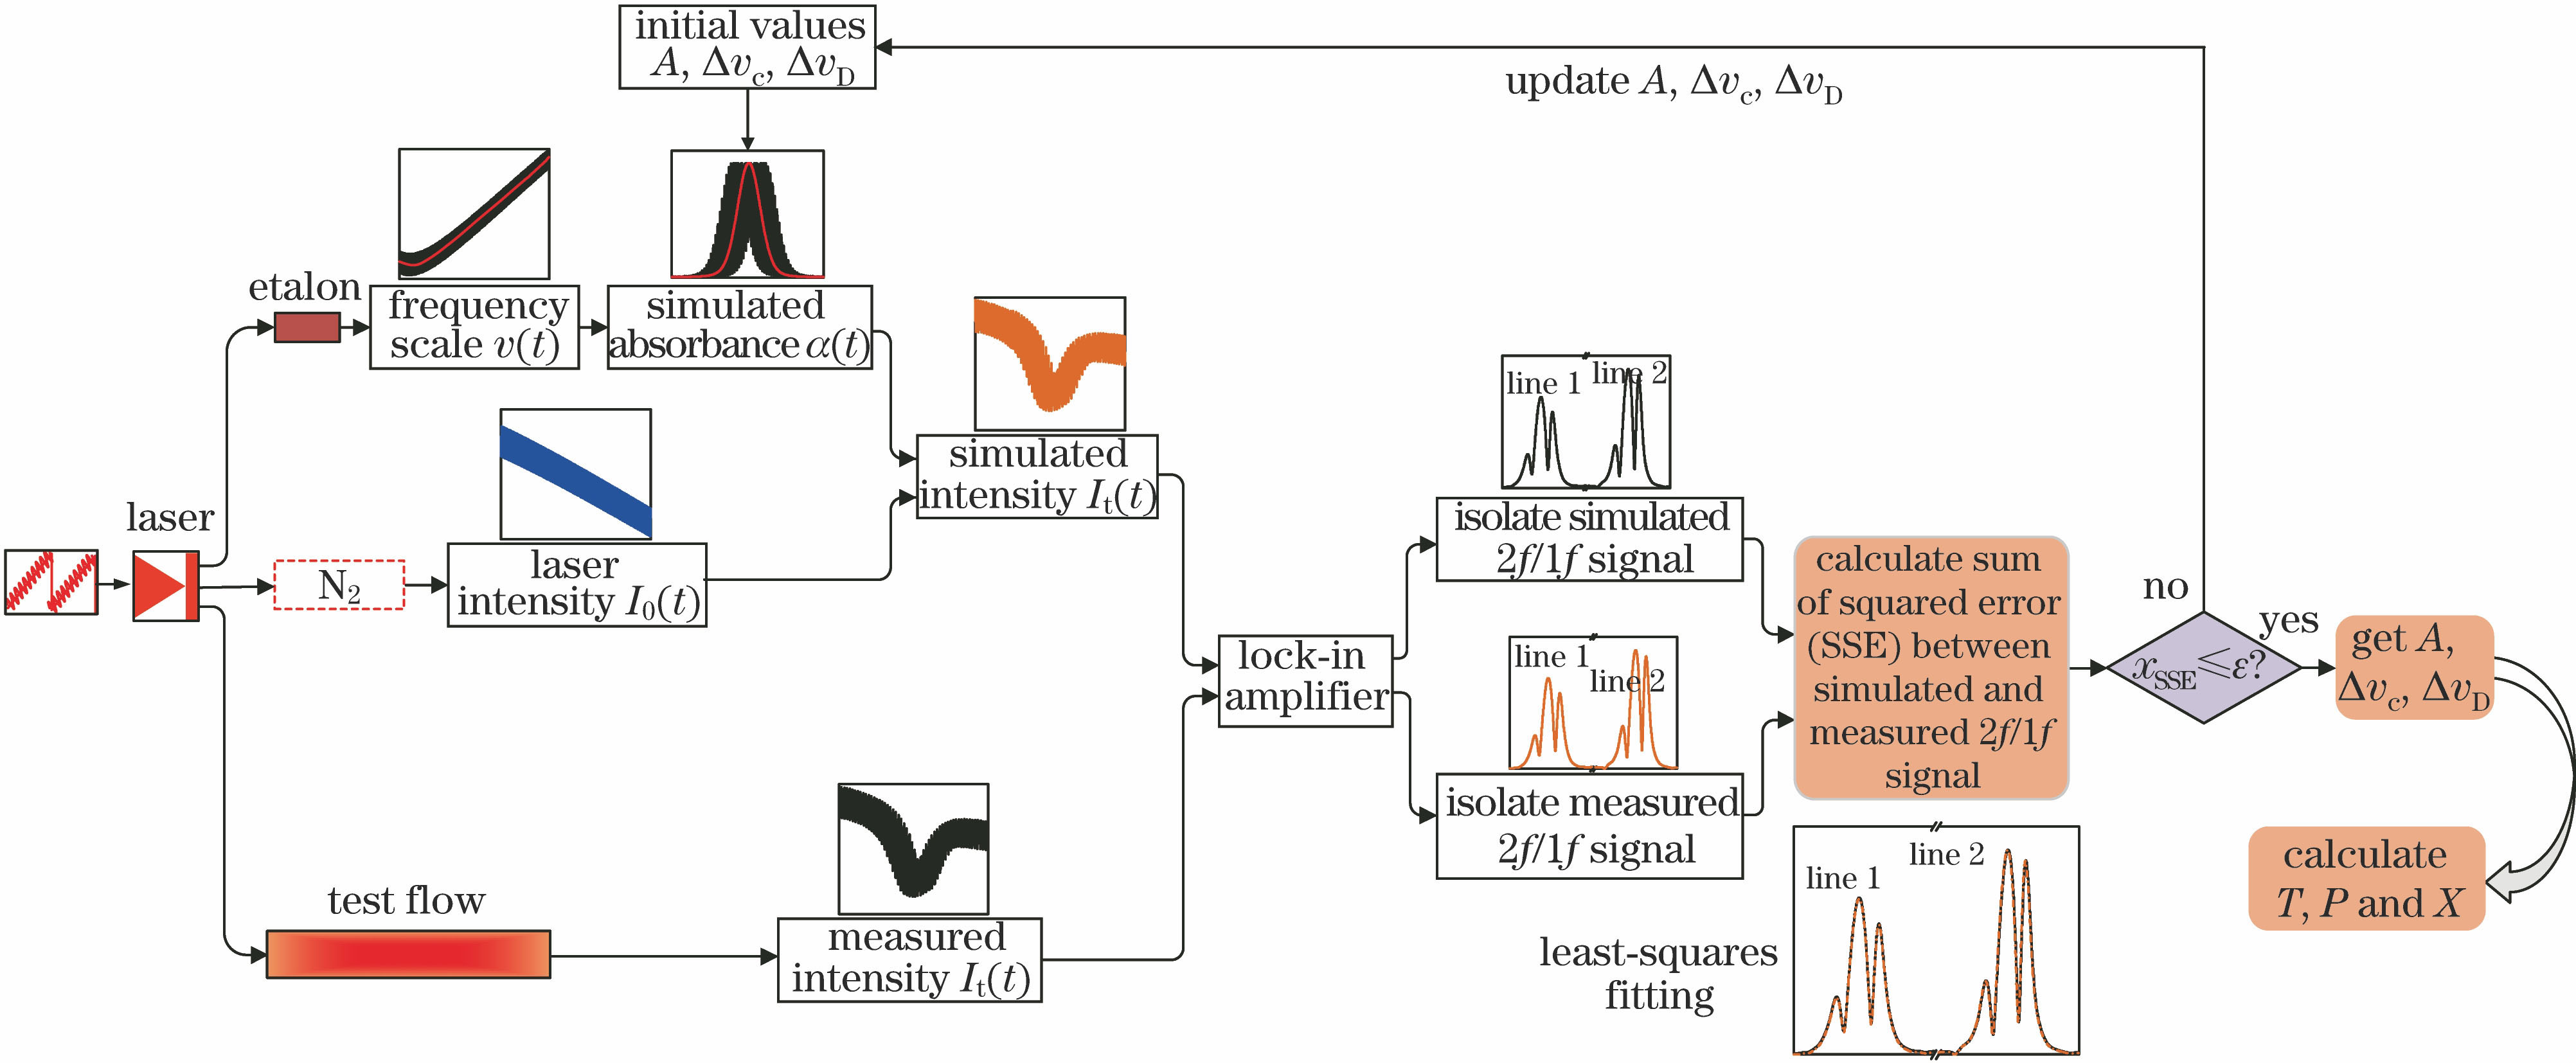
    Fig. 1. Fitting flow chart for harmonic signal based on WMS
    Variation of sensitivity δA of 2f/1f spectra to integrated absorbance A with A
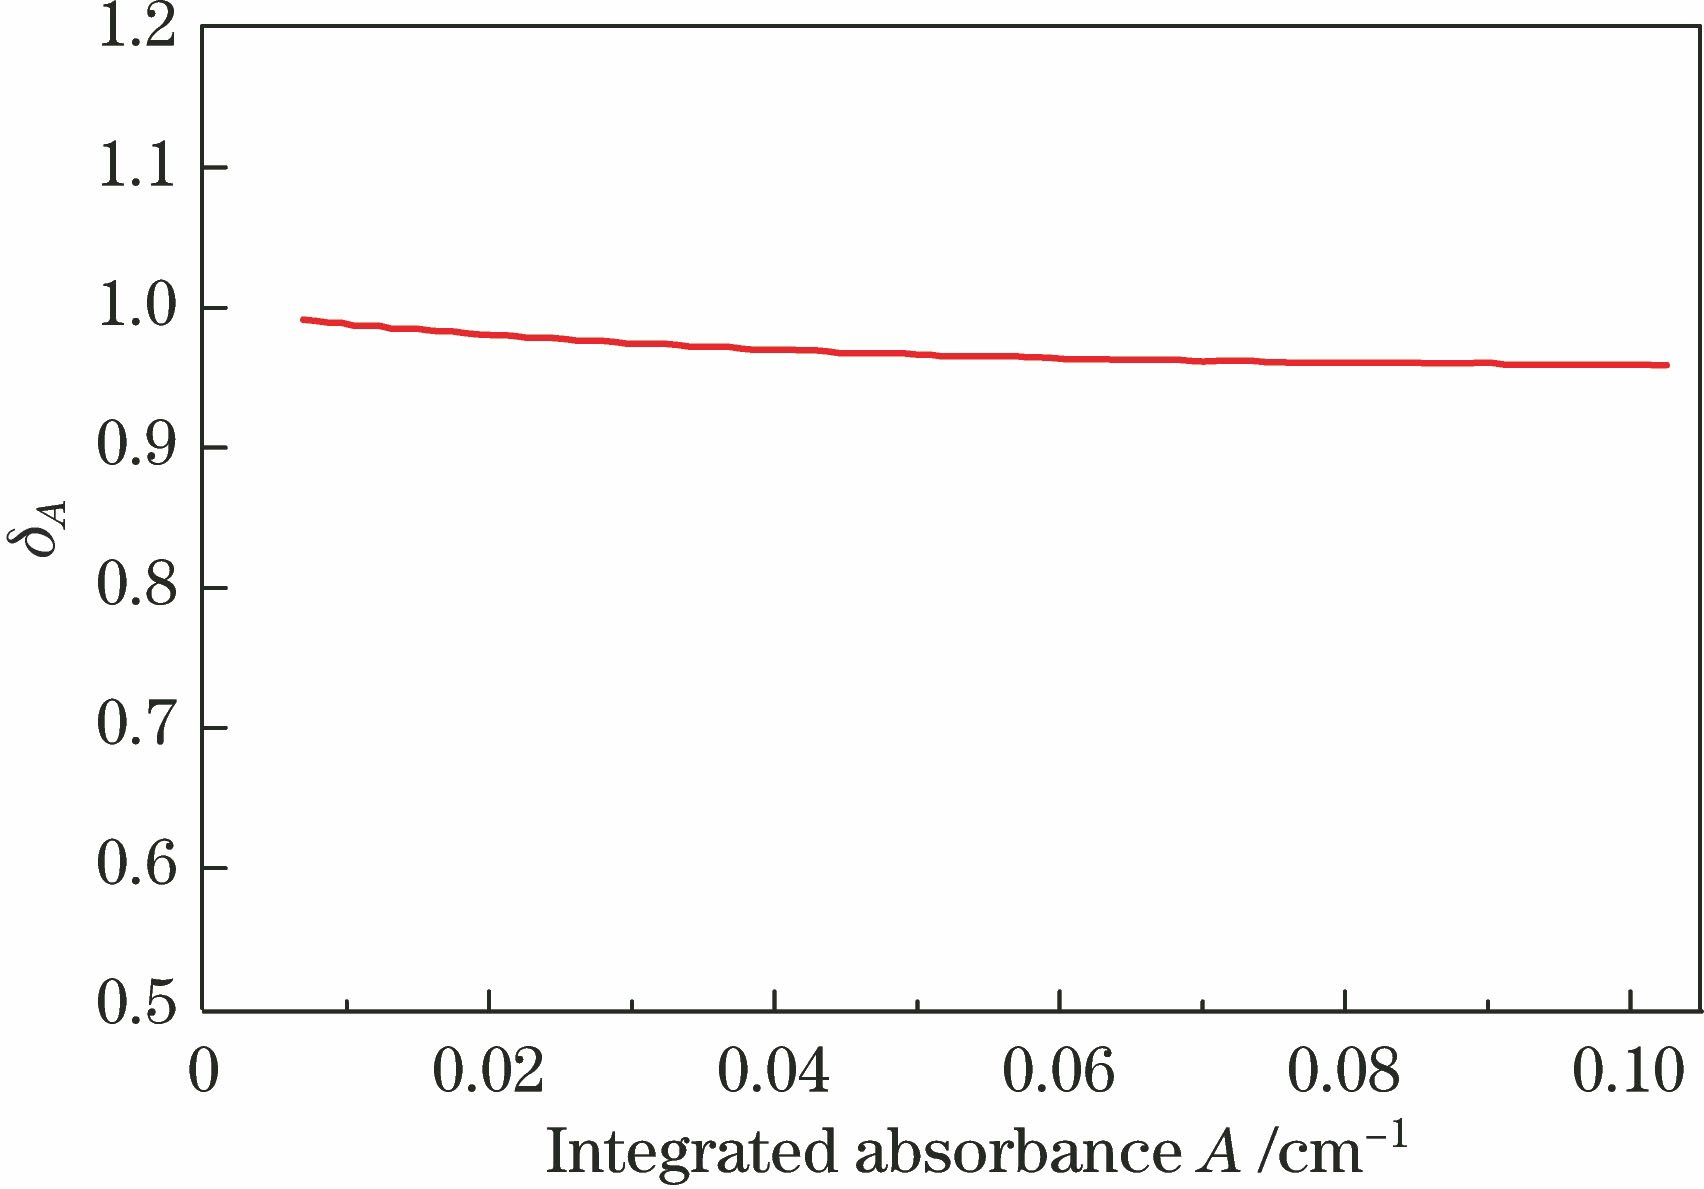
    Fig. 2. Variation of sensitivity δA of 2f/1f spectra to integrated absorbance A with A
    Variations of simulated normalized 2f/1f spectra with collisional width Δvc
    Fig. 3. Variations of simulated normalized 2f/1f spectra with collisional width Δvc
    Variation of sensitivity δΔvc of 2f/1f spectrum to collisional width Δvc with Δvc
    Fig. 4. Variation of sensitivity δΔvc of 2f/1f spectrum to collisional width Δvc with Δvc
    Diagram of experimental setup
    Fig. 5. Diagram of experimental setup
    Detected signal under the conditions of pressure of 101.325 kPa, temperature of 1000 K, and vapour mole fraction of 6.53%
    Fig. 6. Detected signal under the conditions of pressure of 101.325 kPa, temperature of 1000 K, and vapour mole fraction of 6.53%
    Updating processes of (a) A and (b) ΔvD or Δvc of two spectral lines
    Fig. 7. Updating processes of (a) A and (b) ΔvD or Δvc of two spectral lines
    Comparison of simulated and experimental 2f/1f signals of two spectral lines after fitting. (a) Spectral line 1; (b) spectral line 2
    Fig. 8. Comparison of simulated and experimental 2f/1f signals of two spectral lines after fitting. (a) Spectral line 1; (b) spectral line 2
    (a) Measured temperature and vapour mole fraction at pressure of 101.325 kPa; (b) measured pressure and vapour mole fraction at temperature of 1000 K
    Fig. 9. (a) Measured temperature and vapour mole fraction at pressure of 101.325 kPa; (b) measured pressure and vapour mole fraction at temperature of 1000 K
    Frequency v0 /cm-1Air-broadened coefficient γair /(cm-1·kPa-1)nairSelf-broadened coefficient γself /(cm-1·kPa-1)nself
    7185.600.000404600.650.00202320.59
    7454.450.000318780.370.00195410.56
    Table 1. Partial spectrum parameters of spectral lines with frequencies of 7185.60 cm-1 and 7454.45 cm-1
    Dongsheng Qu, Yanji Hong, Guangyu Wang, Mingdong Wang. Measurement Method for Gas Parameters in Combustion Flow Based on Spectroscopy Fitting[J]. Acta Optica Sinica, 2017, 37(12): 1230001
    Download Citation