
Mingyou Chen, Yunchao Tang, Xiangjun Zou, Kuangyu Huang, Wenxian Feng, Po Zhang. Multi-Shaped Targets Recognition and Point Clouds Acquisition Algorithm in Complex Environment[J]. Laser & Optoelectronics Progress, 2018, 55(11): 111505
- Laser & Optoelectronics Progress
- Vol. 55, Issue 11, 111505 (2018)
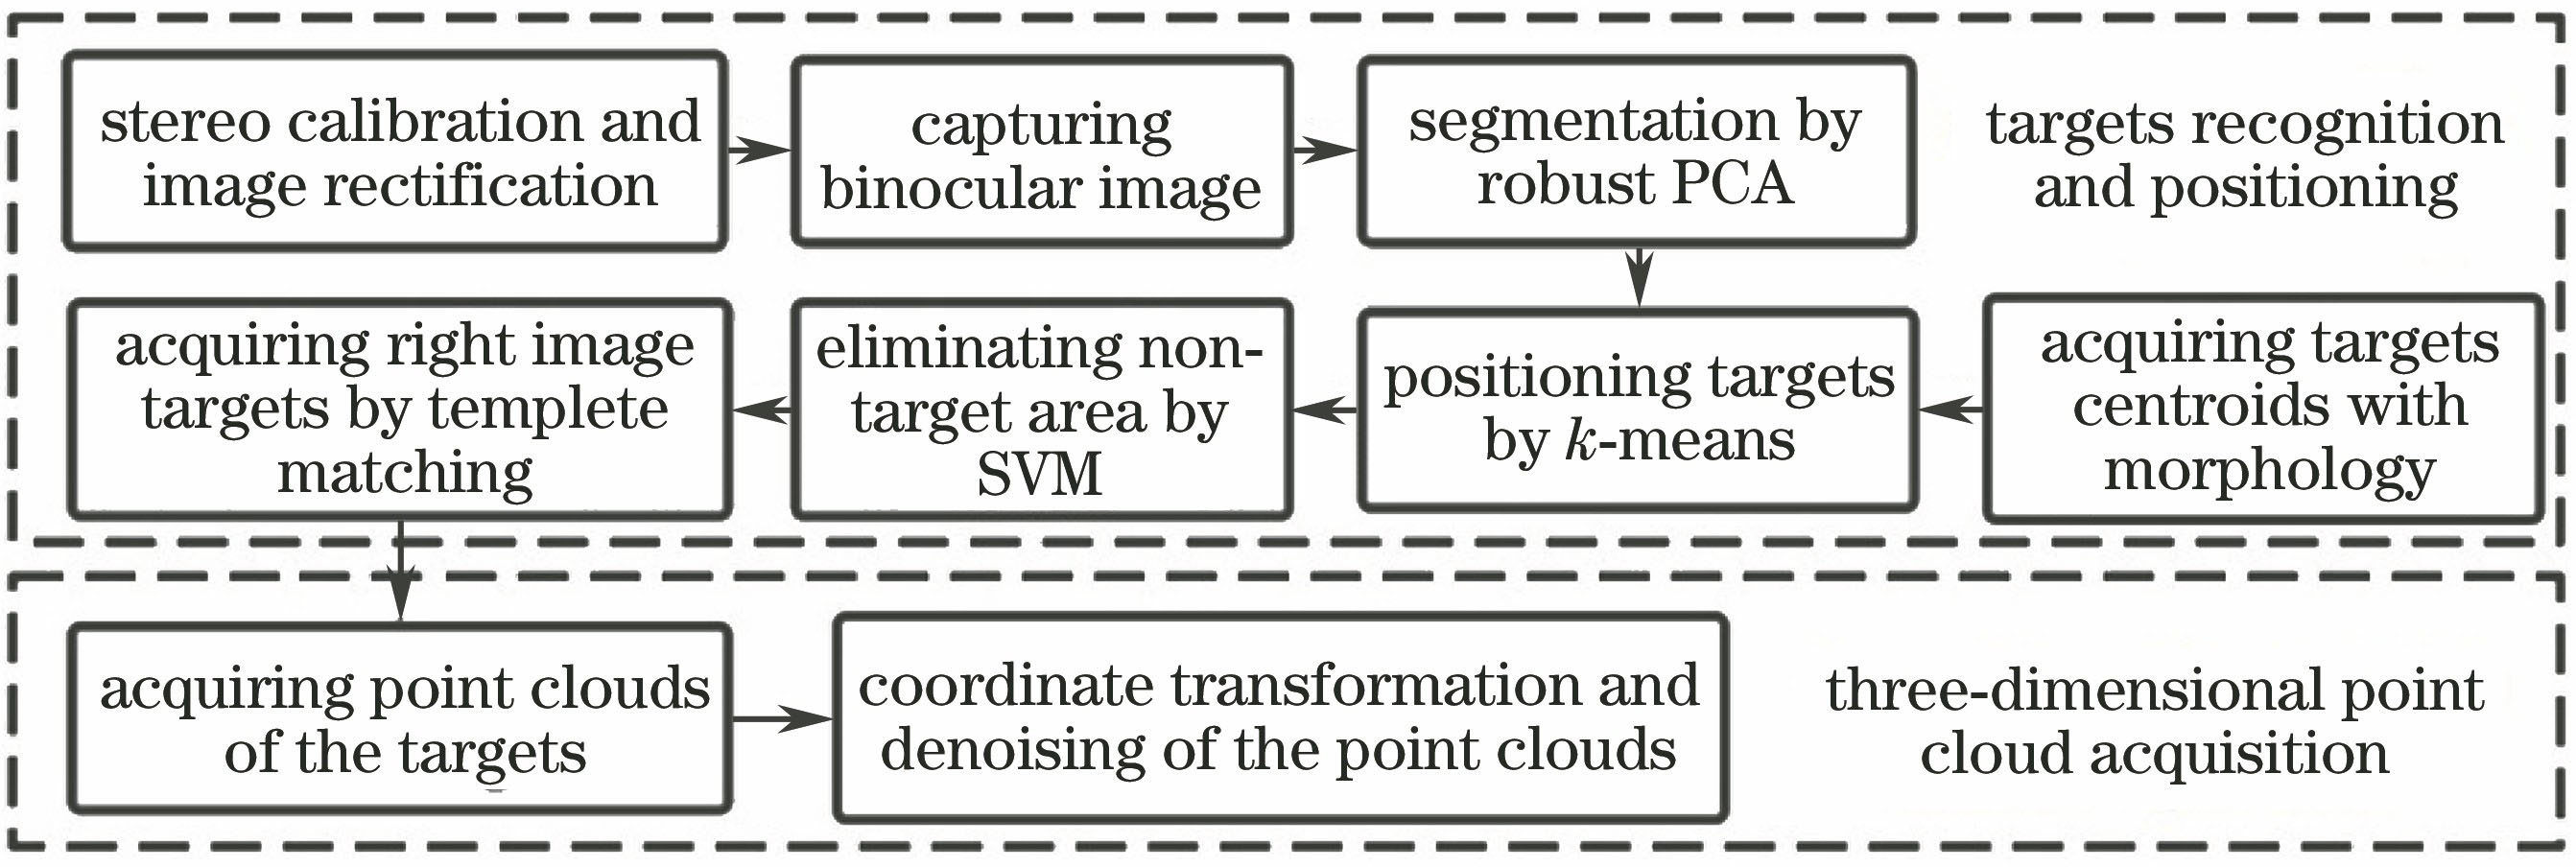
Fig. 1. Workflow of algorithm
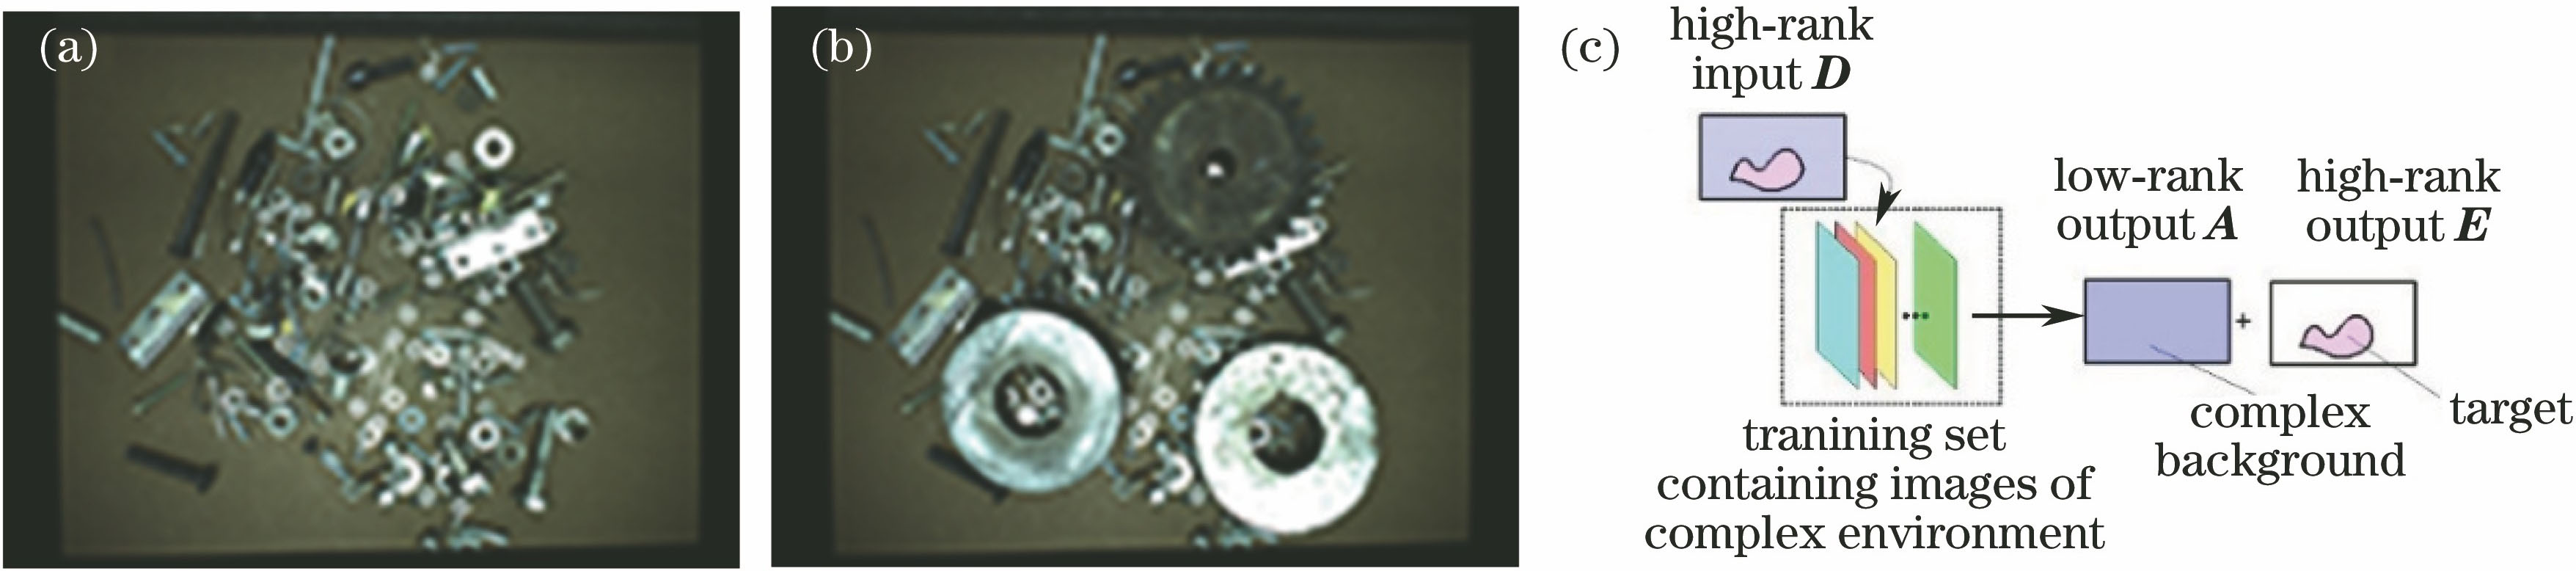
Fig. 2. Schematic of RPCA scene sample training. (a) One of the scene samples; (b) target sample; (c) training process
Fig. 3. Schematic diagram of RPCA in image segmentation. (a) Image to be segmented; (b) high-rank noises (targets)
Fig. 4. Effect of morphology operation. (a) Adaptive thresholding segmentation to high-rank noises; (b) morphology operation; (c) corresponding pixels in original image
Fig. 5. Improved k-means clustering process
Fig. 6. Schematic of SVM classification. (a) Input regions; (b) output targets with label 1; (c) output targets with label 0; (d) training and classification progress
Fig. 7. Schematic of epipolar line rectification
Fig. 8. Template searching matching point through epipolar line
Fig. 9. Positioning of right image objects. (a) Targets labeled 1; (b) targets labeled 0
Fig. 10. Relationship between new and old coordinates
Fig. 11. Illustration of advanced pass through denoising
Fig. 12. Schematic of radium filtering
Fig. 13. Contrast before and after denoising. (a) Original point clouds; (b) denoised point clouds
Fig. 14. Experimental platform
Fig. 15. Schematic of location effect of different algorithms in complex environment. (a)-(d) Messy background with identical color; (e) stacked targets with weak light; (f) messy background with nonlinear light
Fig. 16. Data of algorithm efficiency. (a) Contrast of calculation quantity; (b) contrast of running time
Fig. 17. Experimental data of algorithm error. (a) Cylinder measuring error; (b) square measuring error; (c) gear measuring error
|
Table 1. Recognizing rate of new targets

Set citation alerts for the article
Please enter your email address
© Copyright 2018-2021 | Chinese Laser Press. All Rights Reserved 沪ICP备15018463号-20