• Journal of Infrared and Millimeter Waves
  • Vol. 40, Issue 6, 738 (2021)
Wan-Ting HE1、2, Bo ZHANG1、2, Bin WANG1、2, Xiao-Wei SUN3, Ming-Hui YANG3, and Xiao-Feng WU1、2、*
Author Affiliations
  • 1Key Laboratory for Information Science of Electromagnetic Waves (MoE),Fudan University,Shanghai 200433,China
  • 2Research Center of Smart Networks and Systems,School of Information Science and Technology,Fudan University,Shanghai 200433,China
  • 3Key Laboratory of Terahertz Technology,Shanghai Institute of Microsystem and Information Technology,Shanghai 200050,China
  • show less
    DOI: 10.11972/j.issn.1001-9014.2021.06.006 Cite this Article
    Wan-Ting HE, Bo ZHANG, Bin WANG, Xiao-Wei SUN, Ming-Hui YANG, Xiao-Feng WU. Concealed Object Detection in Millimeter Wave Image Based on Global Correlation of Multi-level Features in Cross-section Sequence[J]. Journal of Infrared and Millimeter Waves, 2021, 40(6): 738 Copy Citation Text show less
    MMW imaging system (a)prototype of Sim-Image,(b)examples of contraband
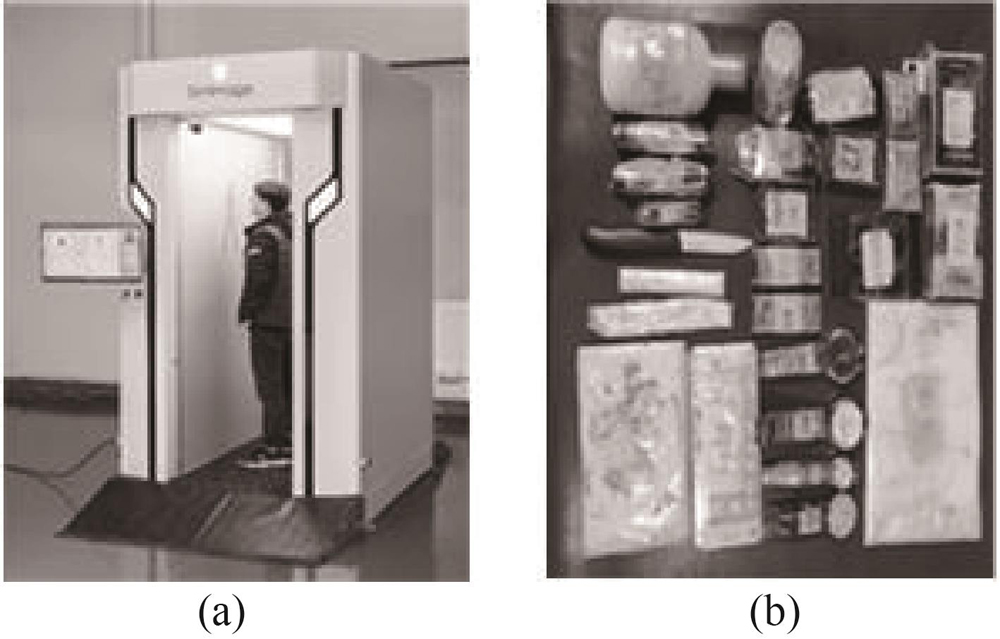
    Fig. 1. MMW imaging system (a)prototype of Sim-Image,(b)examples of contraband
    Diagram of MMW imaging system
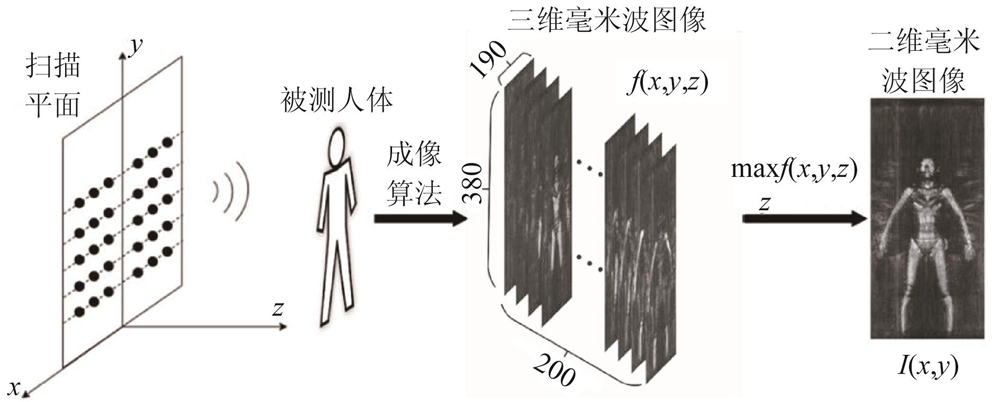
    Fig. 2. Diagram of MMW imaging system
    Examples of MMW image processing (a)、(c)2D MMW image with ground truth of difficult case 1 and 2,(b)、(d)illustration of the sampling process
    Fig. 3. Examples of MMW image processing (a)、(c)2D MMW image with ground truth of difficult case 1 and 2,(b)、(d)illustration of the sampling process
    Analysis results of difficult case 1 intensity distribution curve of sampling point along depth direction of (a)object and (b)background,(c)comparison of the average intensity distribution curve of the object and the background area along the depth direction,(d-f)example of MMW cross-section corresponding to interval I,II and III
    Fig. 4. Analysis results of difficult case 1 intensity distribution curve of sampling point along depth direction of (a)object and (b)background,(c)comparison of the average intensity distribution curve of the object and the background area along the depth direction,(d-f)example of MMW cross-section corresponding to interval I,II and III
    Analysis results of difficult case 2 intensity distribution curve of sampling point along depth direction of (a)object and (b)background
    Fig. 5. Analysis results of difficult case 2 intensity distribution curve of sampling point along depth direction of (a)object and (b)background
    Comparison of intensity distribution between object and noise (a)(e)2D MMW image with sampling area,intensity distribution curve in depth direction of (b)(f)object,and (c-d)、(g-h)noise
    Fig. 6. Comparison of intensity distribution between object and noise (a)(e)2D MMW image with sampling area,intensity distribution curve in depth direction of (b)(f)object,and (c-d)、(g-h)noise
    The overall framework of the proposed method
    Fig. 7. The overall framework of the proposed method
    Structure of intra-section context extraction module
    Fig. 8. Structure of intra-section context extraction module
    Commom structure of LSTM[17]
    Fig. 9. Commom structure of LSTM17
    Illustration of our dataset (a)3D MMW image,(b)the projection in the y-direction,(c)the projection in the x-direction,(d)statistical analysis result of the dataset
    Fig. 10. Illustration of our dataset (a)3D MMW image,(b)the projection in the y-direction,(c)the projection in the x-direction,(d)statistical analysis result of the dataset
    Structure of the ablation model
    Fig. 11. Structure of the ablation model
    The visualization results of the CAM of feature map (a)the image to be measured with ground truth,(b)the salient region of the feature map obtained by the traditional method,(c)the salient region of the feature map obtained by the proposed method
    Fig. 12. The visualization results of the CAM of feature map (a)the image to be measured with ground truth,(b)the salient region of the feature map obtained by the traditional method,(c)the salient region of the feature map obtained by the proposed method
    Comparison of CAM visualization of feature maps of cross-section (a-b)the side view of 3D MMW image to be measured,CAM results and the side view (c)before,and (d)after Bi-CLSTM
    Fig. 13. Comparison of CAM visualization of feature maps of cross-section (a-b)the side view of 3D MMW image to be measured,CAM results and the side view (c)before,and (d)after Bi-CLSTM
    Comparison P-R curve
    Fig. 14. Comparison P-R curve
    Detection Framework输入图像类型mAP/ (%)漏检率/(%)检测时间/ms
    YOLO-v2二维毫米波图像(投影)61.20±6.6214.69
    SSD二维毫米波图像(投影)73.92±2.2011.352
    所提议模型三维毫米波图像82.34±1.435.9126
    Table 1. Accuracy comparison with mainstream method of MMW image object detection
    Detection FrameworkmAP/(%)
    消融模型75.52±2.28
    所提议模型82.34±1.43
    Table 2. Validation of Bi-CLSTM
    Detection Framework候选框数量
    基于二维图像的检测模型6
    截面预测合成模型10
    所提议模型4
    Table 3. Number of candidate bounding boxes predicted by different method
    Wan-Ting HE, Bo ZHANG, Bin WANG, Xiao-Wei SUN, Ming-Hui YANG, Xiao-Feng WU. Concealed Object Detection in Millimeter Wave Image Based on Global Correlation of Multi-level Features in Cross-section Sequence[J]. Journal of Infrared and Millimeter Waves, 2021, 40(6): 738
    Download Citation