
Jiajie Hu, Sumei Li, Yongli Chang, Chunping Hou. Comfortable Disparity Range of Stereo Image Based on Salient Region[J]. Acta Optica Sinica, 2018, 38(8): 0811001
- Acta Optica Sinica
- Vol. 38, Issue 8, 0811001 (2018)
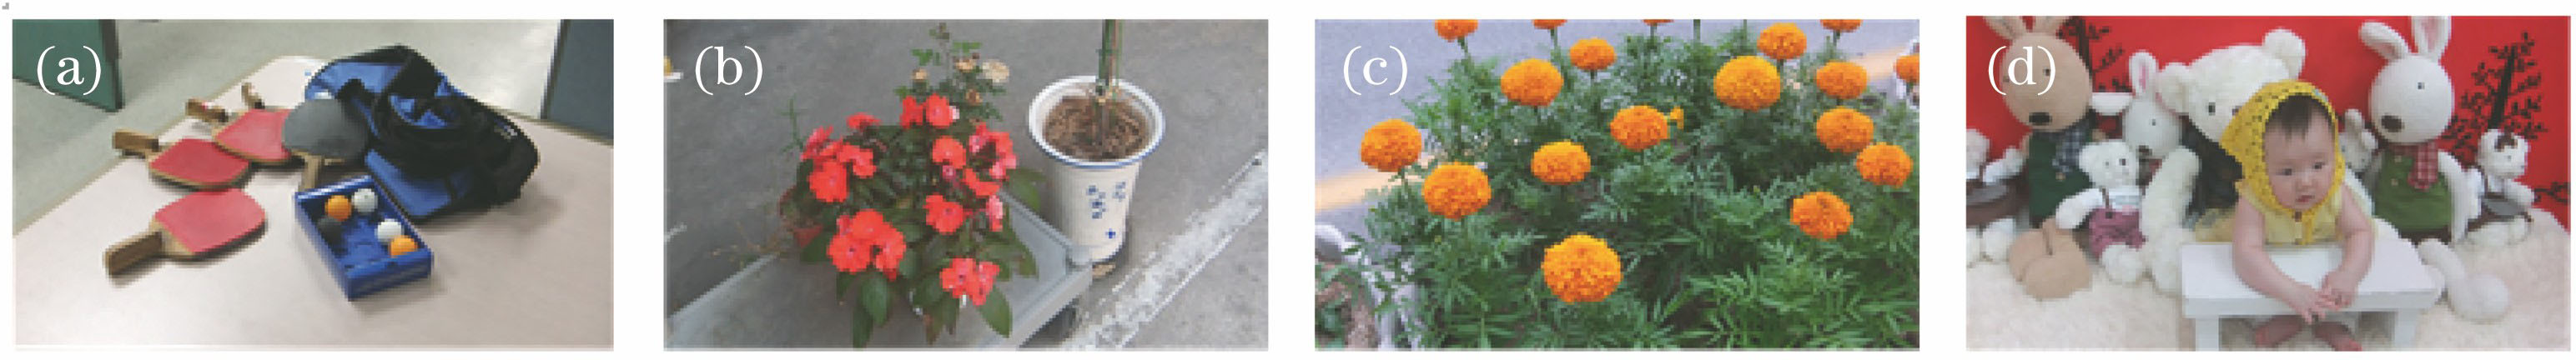
Fig. 1. Four original stereoscopic images.(a) Ball; (b) plant; (c) flower; (d) baby
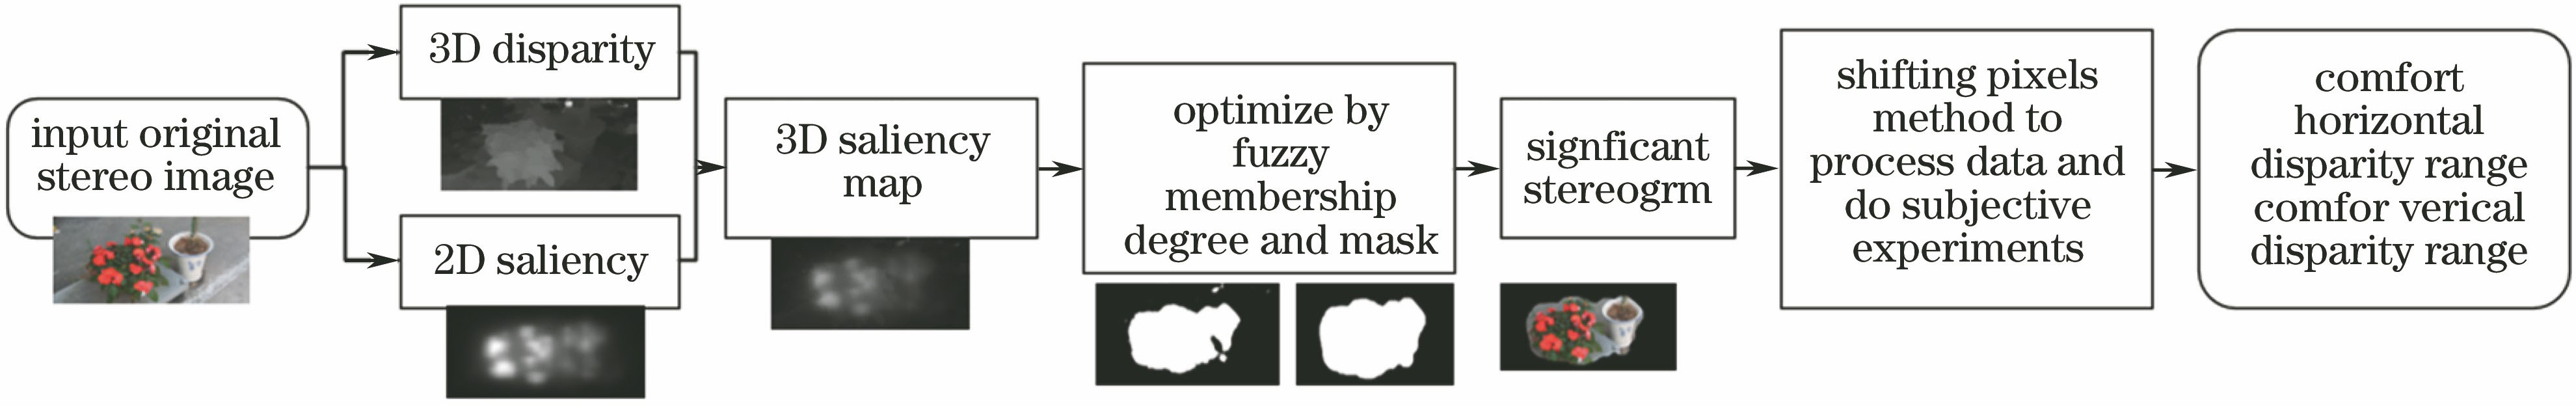
Fig. 2. Flowchart of algorithm
Fig. 3. Serial images during salient stereoscopic images obtaining. (a) Right view; (b) disparity map; (c) 2D salient map; (d) 3D salient map; (e) mask map; (f) optimized mask map; (g) salient stereo map
Fig. 4. Salient hot map of eye tracker experiment
Fig. 5. Schematic of positive and negative horizontal disparity
Fig. 6. MOS of eight stereo images varies with horizontal disparity
Fig. 7. MOS of source stereo images varies with horizontal disparity
Fig. 8. MOS of eight stereo images varies with vertical disparity
Fig. 9. MOS of source stereo images varies with vertical disparity
Fig. 10. Contrast map of horizontal and vertical disparity
Fig. 11. Comparison of experimental results of horizontal disparity with different methods. (a) Method in Ref.[8]; (b) proposed method
Fig. 12. Part of original stereoscopic images. (a) Toy; (b) drinking; (c) tree; (d) house; (e) slide; (f) seat
|
Table 1. Attribute of region R1-R5
| |||||||||||||||||||
Table 2. Correspondence between comfort and parallax of stereo image based on significant region

Set citation alerts for the article
Please enter your email address
© Copyright 2018-2021 | Chinese Laser Press. All Rights Reserved 沪ICP备15018463号-20