• Photonics Research
  • Vol. 9, Issue 7, 1344 (2021)
Yuanbin Jin1、2, Jiangwei Yan1、2, Shah Jee Rahman1、2, Jie Li3, Xudong Yu1、2、4、*, and Jing Zhang1、5、*
Author Affiliations
  • 1State Key Laboratory of Quantum Optics and Quantum Optics Devices, Institute of Opto-Electronics, Shanxi University, Taiyuan 030006, China
  • 2Collaborative Innovation Center of Extreme Optics, Shanxi University, Taiyuan 030006, China
  • 3Zhejiang Province Key Laboratory of Quantum Technology and Device, Department of Physics and State Key Laboratory of Modern Optical Instrumentation, Zhejiang University, Hangzhou 310027, China
  • 4e-mail: jiance_yu@sxu.edu.cn
  • 5e-mail: jzhang74@sxu.edu.cn
  • show less
    DOI: 10.1364/PRJ.422975 Cite this Article Set citation alerts
    Yuanbin Jin, Jiangwei Yan, Shah Jee Rahman, Jie Li, Xudong Yu, Jing Zhang. 6 GHz hyperfast rotation of an optically levitated nanoparticle in vacuum[J]. Photonics Research, 2021, 9(7): 1344 Copy Citation Text show less
    Schematic diagram of the experimental setup, which includes five parts: vacuum system, rotation detection, torsional vibration detection, CoM motion detection, and feedback system. AOM, acousto-optic modulator; λ/4, quarter-wave plate; λ/2, half-wave plate; PBS1–PBS5, polarized beam splitters; DM, D-shape mirror; BD, beam dump.
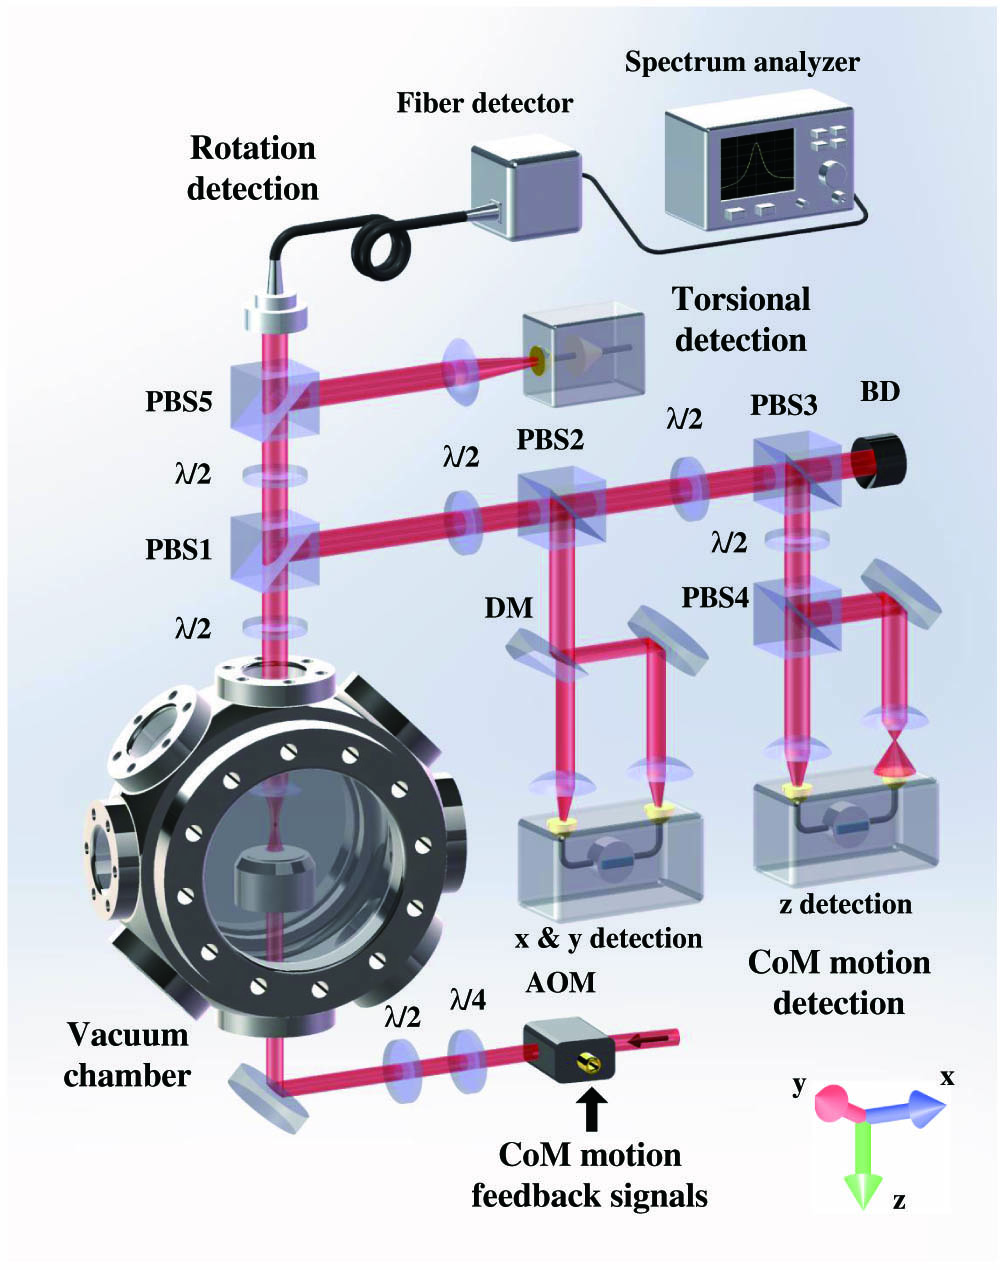
    Fig. 1. Schematic diagram of the experimental setup, which includes five parts: vacuum system, rotation detection, torsional vibration detection, CoM motion detection, and feedback system. AOM, acousto-optic modulator; λ/4, quarter-wave plate; λ/2, half-wave plate; PBS1–PBS5, polarized beam splitters; DM, D-shape mirror; BD, beam dump.
    Measured rotation frequency versus the power of a near circularly polarized trapping laser at 1 Pa. The mass of the nanoparticle is about 7.2×10⁻¹⁵ g. The dashed line is a linear fitting.
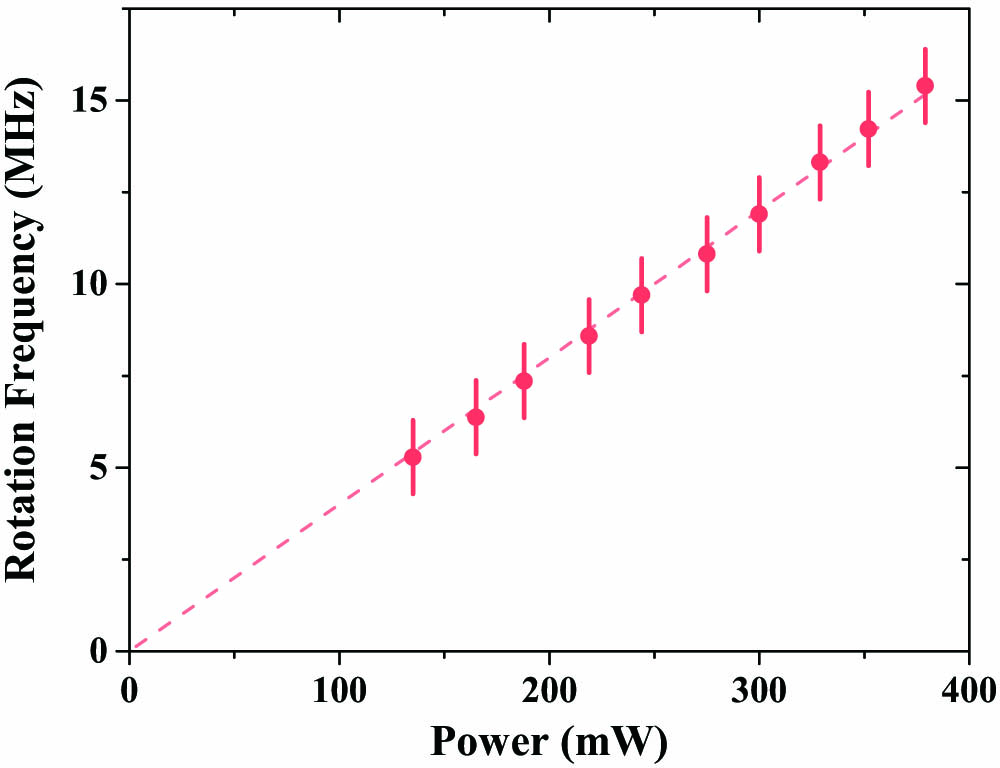
    Fig. 2. Measured rotation frequency versus the power of a near circularly polarized trapping laser at 1 Pa. The mass of the nanoparticle is about 7.2×10¹⁵g. The dashed line is a linear fitting.
    Measured rotation frequency versus the angle of the fast axis of the quarter-wave plate at different pressures. The red, green, and purple traces are measured at 5 Pa, 0.5 Pa, and 0.1 Pa, respectively. The dashed lines are the corresponding theoretical fittings using fr=Re[a(1−cos b)2sin2(2θ)−sin2(b)cos2(2θ)] [34,46], where θ is the angle of the quarter-wave plate before the objective lens, a depends on the air pressure, and b is the phase shift induced by the medium. The mass of the nanoparticle is about 6.5×10⁻¹⁵ g.
    Fig. 3. Measured rotation frequency versus the angle of the fast axis of the quarter-wave plate at different pressures. The red, green, and purple traces are measured at 5 Pa, 0.5 Pa, and 0.1 Pa, respectively. The dashed lines are the corresponding theoretical fittings using fr=Re[a(1cosb)2sin2(2θ)sin2(b)cos2(2θ)] [34,46], where θ is the angle of the quarter-wave plate before the objective lens, a depends on the air pressure, and b is the phase shift induced by the medium. The mass of the nanoparticle is about 6.5×10¹⁵g.
    The experimental results without feedback cooling. (a) Measured rotation frequency of three trapped nanoparticles (green, blue, and red traces) versus air pressure without feedback cooling. The masses of the three nanoparticles are about 5.8×10⁻¹⁵ g, 1.1×10⁻¹⁴ g, and 7.2×10⁻⁵ g, respectively. The dashed color lines are the corresponding theoretical fittings according to the inverse ratio of the rotation frequency and the pressure. (b) Power spectral density of a rotation signal of 8.6 GHz at 0.01 Pa. (c) Standard deviation of the rotation frequency versus air pressure measured for one of the nanoparticles. At each pressure, we perform 120 measurements to obtain the standard deviation. In (a)–(c), the measurements are performed using a near circularly polarized trapping laser with a fixed laser power 300 mW. The gray dashed lines in (a) and (c) are the boundaries of the pressure measurements using the two gauges. (d), (e) The CoM motion and torsional vibration signals of two nanoparticles [corresponding to red and green traces in (a)] at 500 Pa for a linearly polarized trapping laser (the polarization direction is along the x axis). The damping rates of the CoM motions in three directions are different, which indicates that the nanoparticles are not perfect spheres [35,36]. In (d), γx=2π×2.69 kHz, γy=2π×2.78 kHz, γz=2π×2.83 kHz; thus the ratios are γy/γx=1.03 and γz/γx=1.05. In (e), γx=2π×2.34 kHz, γy=2π×2.80 kHz, γz=2π×2.67 kHz; thus the ratios are γy/γx=1.20 and γz/γx=1.14.
    Fig. 4. The experimental results without feedback cooling. (a) Measured rotation frequency of three trapped nanoparticles (green, blue, and red traces) versus air pressure without feedback cooling. The masses of the three nanoparticles are about 5.8×10¹⁵g, 1.1×10¹⁴g, and 7.2×10⁵g, respectively. The dashed color lines are the corresponding theoretical fittings according to the inverse ratio of the rotation frequency and the pressure. (b) Power spectral density of a rotation signal of 8.6 GHz at 0.01 Pa. (c) Standard deviation of the rotation frequency versus air pressure measured for one of the nanoparticles. At each pressure, we perform 120 measurements to obtain the standard deviation. In (a)–(c), the measurements are performed using a near circularly polarized trapping laser with a fixed laser power 300 mW. The gray dashed lines in (a) and (c) are the boundaries of the pressure measurements using the two gauges. (d), (e) The CoM motion and torsional vibration signals of two nanoparticles [corresponding to red and green traces in (a)] at 500 Pa for a linearly polarized trapping laser (the polarization direction is along the x axis). The damping rates of the CoM motions in three directions are different, which indicates that the nanoparticles are not perfect spheres [35,36]. In (d), γx=2π×2.69  kHz, γy=2π×2.78  kHz, γz=2π×2.83  kHz; thus the ratios are γy/γx=1.03 and γz/γx=1.05. In (e), γx=2π×2.34  kHz, γy=2π×2.80  kHz, γz=2π×2.67  kHz; thus the ratios are γy/γx=1.20 and γz/γx=1.14.
    The fluctuation of the rotation frequency (a) without feedback cooling and (b) with feedback cooling at 0.16 Pa. We sample the rotation frequency 30 times per second. (c) Measured rotation frequency of three trapped nanoparticles (green, blue, and red traces) versus air pressure with feedback cooling. The masses of the three nanoparticles are about 1.2×10⁻¹⁴ g, 7.4×10⁻¹⁵ g, and 7.6×10⁻¹⁵ g, respectively. The dashed color lines are the corresponding fittings using the inverse ratio of the rotation frequency and the pressure. (d) Power spectral density of a rotation signal of 12.17 GHz at 8×10⁻³ Pa. (e) Standard deviation of the rotation frequency versus air pressure measured for one of the nanoparticles. The gray dashed lines in (c) and (e) are the boundaries of the pressure measurements using the two gauges. The trapping beam is a near circularly polarized laser beam in these measurements.
    Fig. 5. The fluctuation of the rotation frequency (a) without feedback cooling and (b) with feedback cooling at 0.16 Pa. We sample the rotation frequency 30 times per second. (c) Measured rotation frequency of three trapped nanoparticles (green, blue, and red traces) versus air pressure with feedback cooling. The masses of the three nanoparticles are about 1.2×10¹⁴g, 7.4×10¹⁵g, and 7.6×10¹⁵g, respectively. The dashed color lines are the corresponding fittings using the inverse ratio of the rotation frequency and the pressure. (d) Power spectral density of a rotation signal of 12.17 GHz at 8×10³  Pa. (e) Standard deviation of the rotation frequency versus air pressure measured for one of the nanoparticles. The gray dashed lines in (c) and (e) are the boundaries of the pressure measurements using the two gauges. The trapping beam is a near circularly polarized laser beam in these measurements.
    Yuanbin Jin, Jiangwei Yan, Shah Jee Rahman, Jie Li, Xudong Yu, Jing Zhang. 6 GHz hyperfast rotation of an optically levitated nanoparticle in vacuum[J]. Photonics Research, 2021, 9(7): 1344
    Download Citation