
Taotao Li, Pei Shen, Xiaoqian Zhong, Xianlei Xu, Jiangying Liu. Research on Imaging Quality Comprehensive Evaluation by Multi-Parameters of Line Structured Light Stripe[J]. Laser & Optoelectronics Progress, 2023, 60(7): 0712005
- Laser & Optoelectronics Progress
- Vol. 60, Issue 7, 0712005 (2023)
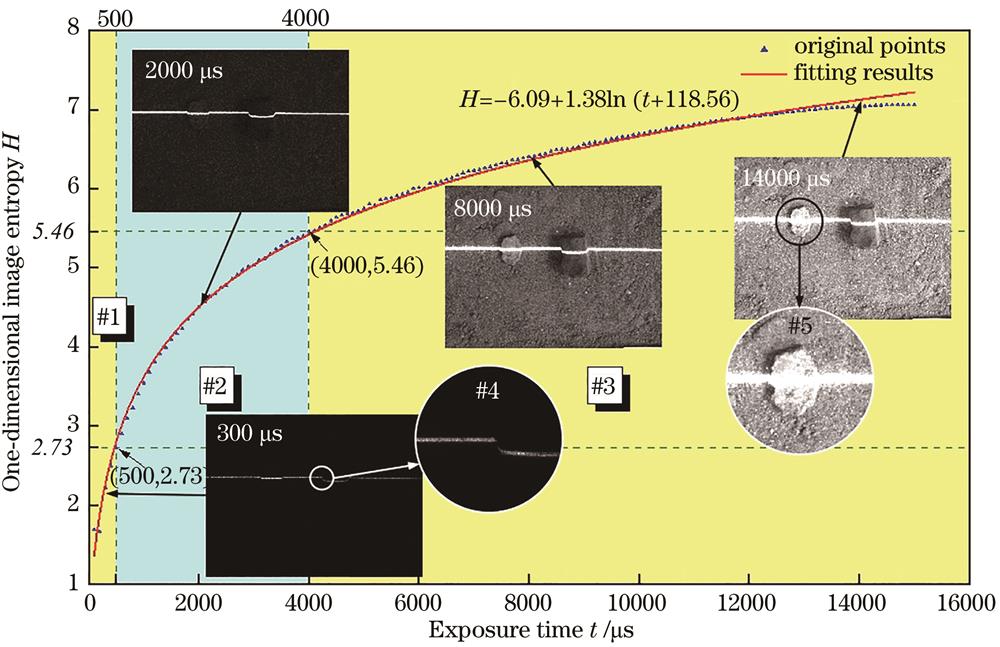
Fig. 1. One-dimensional image entropy changes of light stripe image set
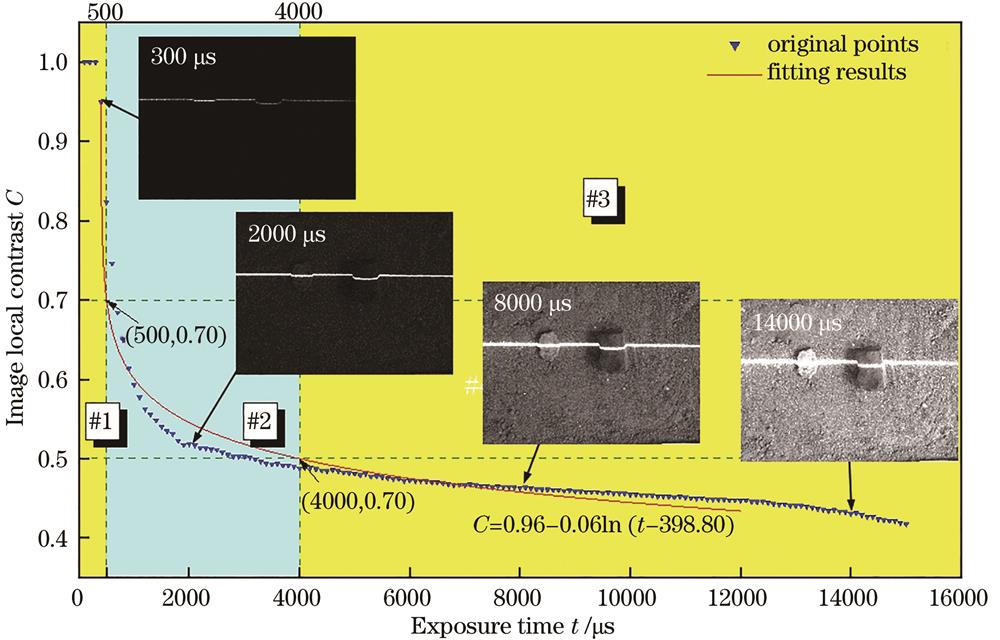
Fig. 2. Local contrast changes of light stripe image set
Fig. 3. Definition coefficient changes of light stripe image set
Fig. 4. Synchronous changes of light stripe image set's H, C, β,and stripe centers extraction deviation Ra
Fig. 5. Light stripe imaging results of metal plate under different exposure time t. (a) t=200 μs; (b) t=1000 μs; (c) t=2000 μs; (d) t=2500 μs; (e) t=5000 μs
Fig. 6. Hign-precision rack
Fig. 7. 3D measurement results of 7th tooth in high-precision rack. (a) 3D reconstruction of tooth profile; (b) Rssa varies with t
| |||||||||||||||||||
Table 1. Corresponding t and H ranges of light stripe imaging quality empirical evaluation results
|
Table 2. Value ranges of H, C, β,and Ra of high quality light stripe images in image set U
|
Table 3. Multi-parameters comprehensive evaluation results of light stripe images in Fig. 5
|
Table 4. Comparison of evaluation results of different methods

Set citation alerts for the article
Please enter your email address
© Copyright 2018-2021 | Chinese Laser Press. All Rights Reserved 沪ICP备15018463号-20