• Photonics Research
  • Vol. 9, Issue 4, B96 (2021)
Ronghui Lin, Zahrah Alnakhli, and Xiaohang Li*
Author Affiliations
  • Advanced Semiconductor Laboratory, King Abdullah University of Science and Technology (KAUST), Thuwal 23955-6900, Saudi Arabia
  • show less
    DOI: 10.1364/PRJ.415655 Cite this Article Set citation alerts
    Ronghui Lin, Zahrah Alnakhli, Xiaohang Li. Engineering of multiple bound states in the continuum by latent representation of freeform structures[J]. Photonics Research, 2021, 9(4): B96 Copy Citation Text show less
    (a) Top, an artistic rendering of the C4v photonic crystal considered. Bottom, planar view of the C4v unit cell and the definition of high symmetry points. (b) Band diagram for TE-like and TM-like modes. (c) Hz and Ez Bloch mode profiles for TE-like and TM-like modes, respectively.
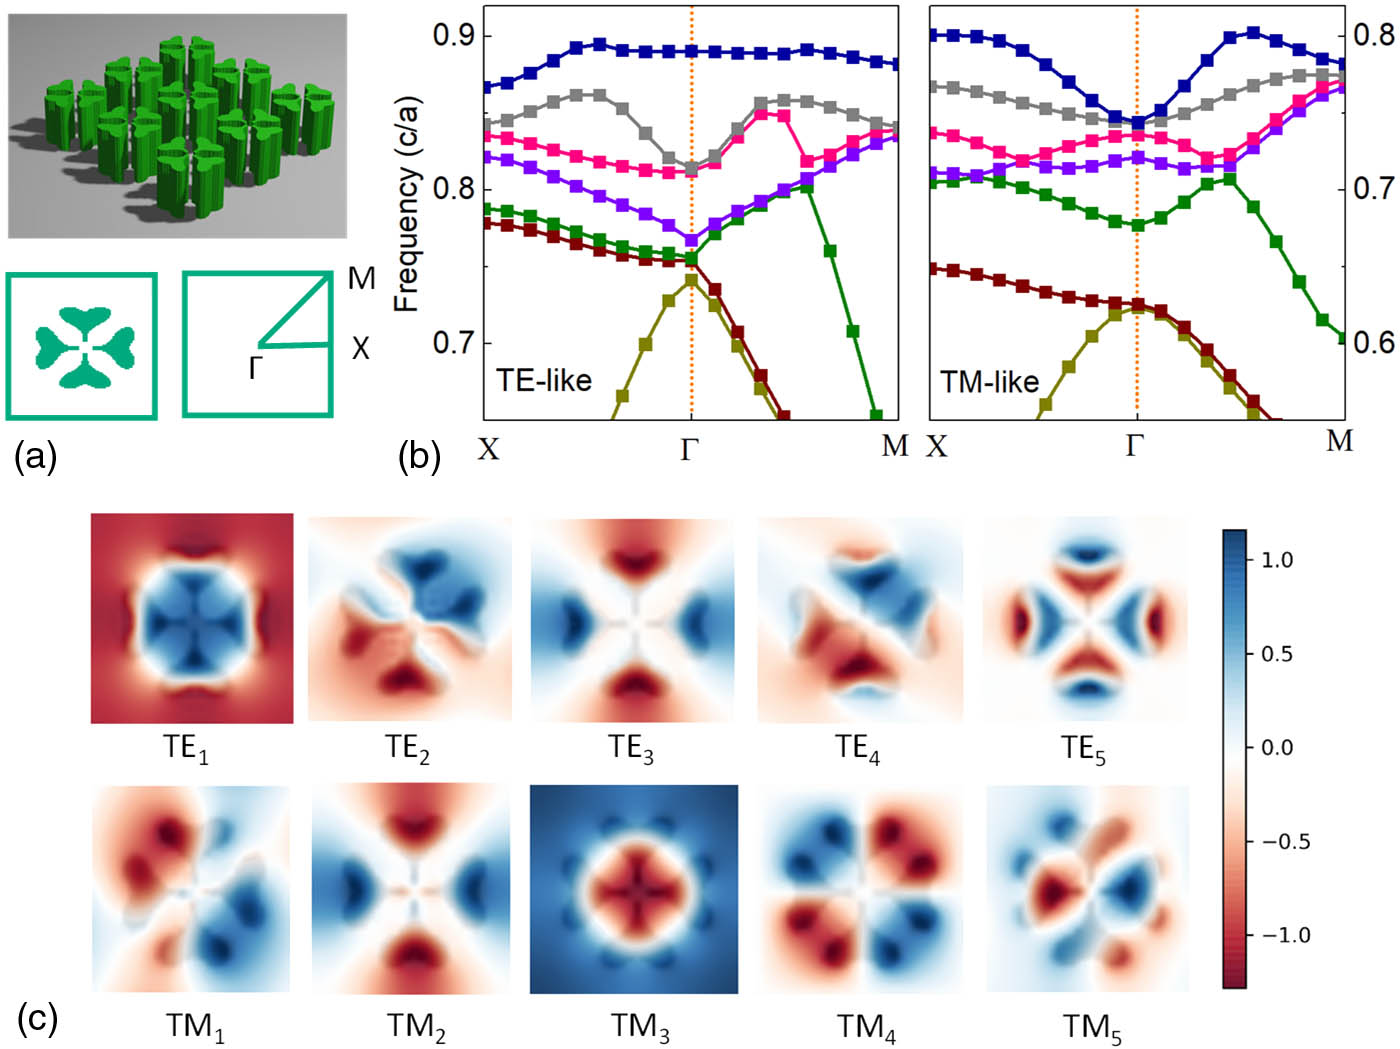
    Fig. 1. (a) Top, an artistic rendering of the C4v photonic crystal considered. Bottom, planar view of the C4v unit cell and the definition of high symmetry points. (b) Band diagram for TE-like and TM-like modes. (c) Hz and Ez Bloch mode profiles for TE-like and TM-like modes, respectively.
    (a) Transmission spectra at different incident angles for s polarization and p polarization. The red arrows indicate the doubly degenerate modes, and the numbered modes are nondegenerate. (b) The Q factors of the BIC modes shown in (a).
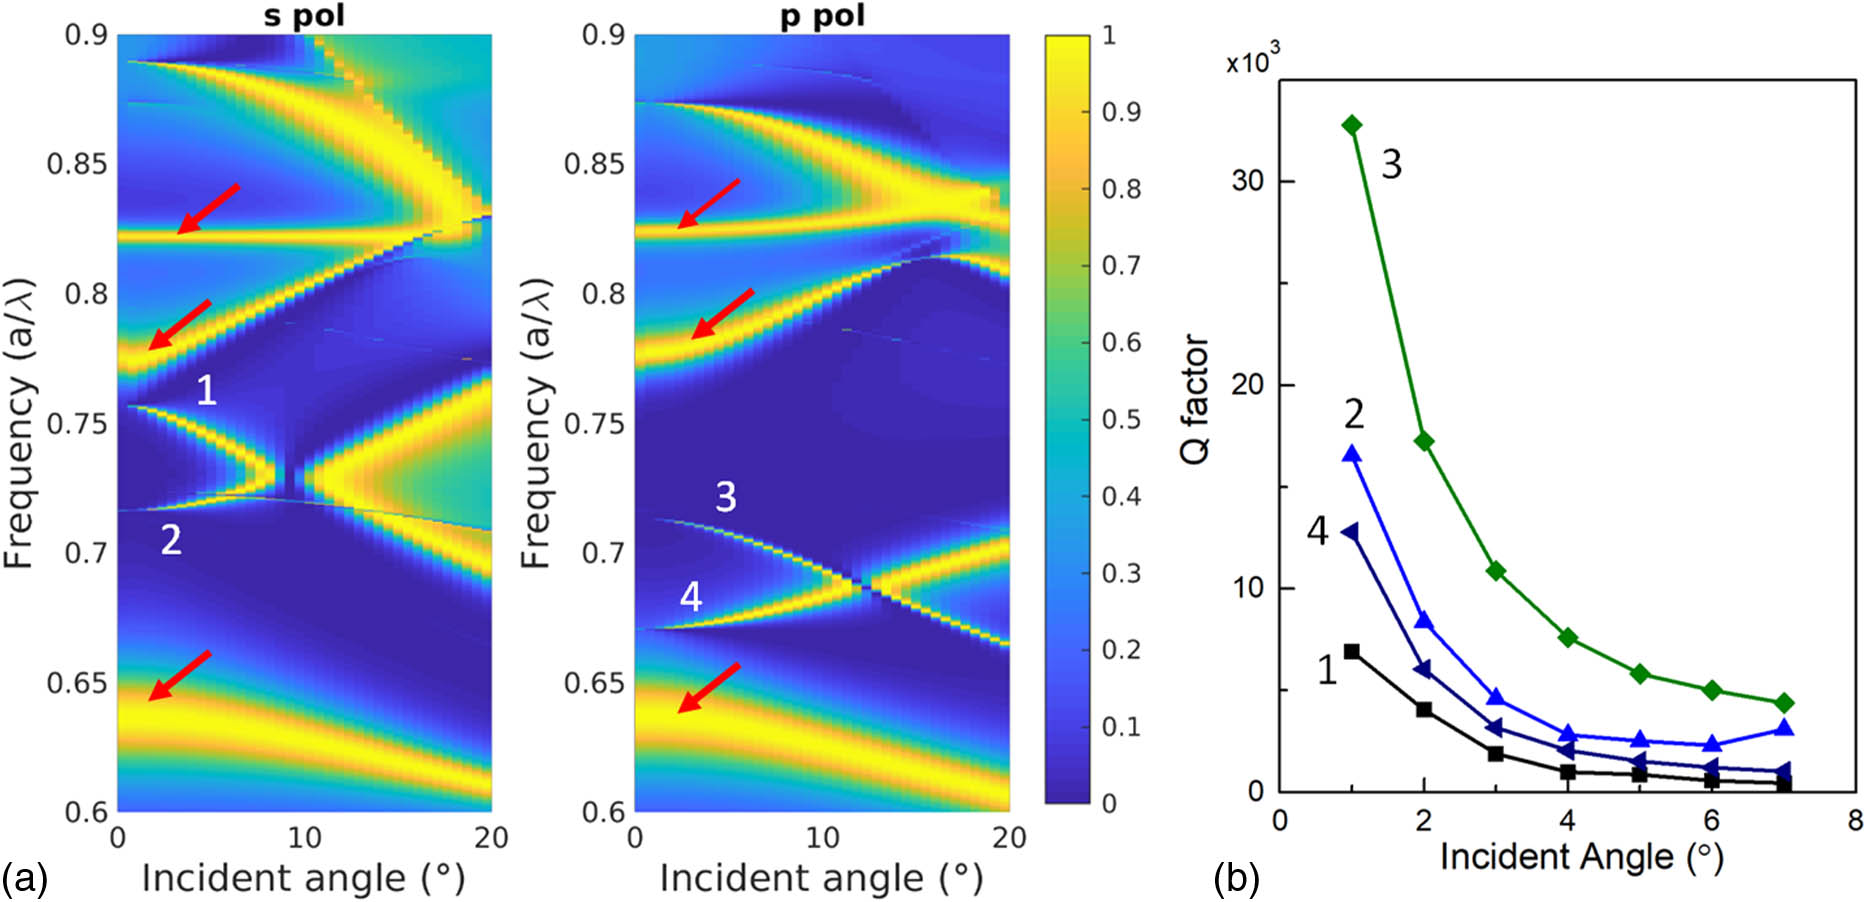
    Fig. 2. (a) Transmission spectra at different incident angles for s polarization and p polarization. The red arrows indicate the doubly degenerate modes, and the numbered modes are nondegenerate. (b) The Q factors of the BIC modes shown in (a).
    (a) VAE structure used for geometry management. (b) The training loss for β-VAE. (c) Examples of the β-VAE generated geometries.
    Fig. 3. (a) VAE structure used for geometry management. (b) The training loss for β-VAE. (c) Examples of the β-VAE generated geometries.
    (a) Shapes of geometry 8 and 12, with the sites of deformation marked by red arrows. (b) The shift of TE-like and TM-like bands at Γ point as the latent vector is varied continuously (see Visualization 1 for the continuous variation of the geometries). (c) Hz field of TE-like modes for geometry 12. The inversed bands are grouped by dashed green boxes.
    Fig. 4. (a) Shapes of geometry 8 and 12, with the sites of deformation marked by red arrows. (b) The shift of TE-like and TM-like bands at Γ point as the latent vector is varied continuously (see Visualization 1 for the continuous variation of the geometries). (c) Hz field of TE-like modes for geometry 12. The inversed bands are grouped by dashed green boxes.
    (a) Shift of TE-like and TM-like bands at Γ point as the scaling factor is varied. The inset in (a) shows the geometry considered. (b) The Ez field of TM-like modes for geometry with a scaling factor of 0.8. The inversed bands are grouped by dashed green boxes.
    Fig. 5. (a) Shift of TE-like and TM-like bands at Γ point as the scaling factor is varied. The inset in (a) shows the geometry considered. (b) The Ez field of TM-like modes for geometry with a scaling factor of 0.8. The inversed bands are grouped by dashed green boxes.
    (a) Whole DNN structure studied in this work. (b) Information flow during training, where 1 is the training of β-VAE, 2 is the training of CNN2, and 3 is the training of CNN1. (c) Information flow for the forward modeling and the inverse design.
    Fig. 6. (a) Whole DNN structure studied in this work. (b) Information flow during training, where 1 is the training of β-VAE, 2 is the training of CNN2, and 3 is the training of CNN1. (c) Information flow for the forward modeling and the inverse design.
    Training and testing losses for (a) CNN2 and (b) CNN1.
    Fig. 7. Training and testing losses for (a) CNN2 and (b) CNN1.
    (a) Correlation between target BIC wavelengths in the validation data set and the output of the DNN. (b) Correlation between randomly generated target BIC wavelengths and the output of the DNN. The x axis is the target value, and the y axis is the DNN output in both (a) and (b).
    Fig. 8. (a) Correlation between target BIC wavelengths in the validation data set and the output of the DNN. (b) Correlation between randomly generated target BIC wavelengths and the output of the DNN. The x axis is the target value, and the y axis is the DNN output in both (a) and (b).
    Demonstration of the multiple BIC inverse design. (a) The comparison of the random target BIC wavelengths, DNN output, and numerical simulation. The inset shows the output geometry of the DNN. (b) Band diagrams for the designed structures. (c) The Hz and Ez field profiles for the TE and TM BIC states, respectively.
    Fig. 9. Demonstration of the multiple BIC inverse design. (a) The comparison of the random target BIC wavelengths, DNN output, and numerical simulation. The inset shows the output geometry of the DNN. (b) Band diagrams for the designed structures. (c) The Hz and Ez field profiles for the TE and TM BIC states, respectively.
    Detailed parameters of the network structure.
    Fig. 10. Detailed parameters of the network structure.
     E2C4C22σv2σd
    A111111
    A2111−1−1
    B11−111−1
    B21−11−11
    E20−200
    Table 1. Character Table for C4v Group
    Ronghui Lin, Zahrah Alnakhli, Xiaohang Li. Engineering of multiple bound states in the continuum by latent representation of freeform structures[J]. Photonics Research, 2021, 9(4): B96
    Download Citation