• Matter and Radiation at Extremes
  • Vol. 7, Issue 2, 028401 (2022)
Jingui Xu1, Dongzhou Zhang1、a), Sergey N. Tkachev2, and Przemyslaw K. Dera1
Author Affiliations
  • 1School of Ocean and Earth Science and Technology, Hawai’i Institute of Geophysics and Planetology, University of Hawai’i at Manoa, Honolulu, Hawaii 96822, USA
  • 2Center for Advanced Radiation Sources, University of Chicago, Chicago, Illinois 60437, USA
  • show less
    DOI: 10.1063/5.0075795 Cite this Article
    Jingui Xu, Dongzhou Zhang, Sergey N. Tkachev, Przemyslaw K. Dera. Partnership for eXtreme Xtallography (PX2)—A state-of-the-art experimental facility for extreme-conditions crystallography: A case study of pressure-induced phase transition in natural ilvaite[J]. Matter and Radiation at Extremes, 2022, 7(2): 028401 Copy Citation Text show less
    Routine set-up for high-pressure SCXRD at PX2, including a monochromated x-ray beam (0.4340 Å in wavelength and 12 × 18 µm2 in beam size), a Pilatus3S 1M area detector, an online ruby fluorescence system, and a membrane system for remote pressure control. The φ rotation is applied to the six-circle diffractometer.
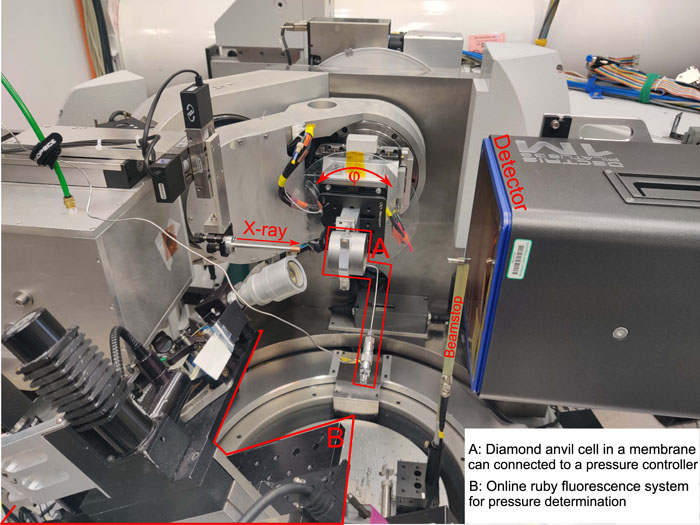
    Fig. 1. Routine set-up for high-pressure SCXRD at PX2, including a monochromated x-ray beam (0.4340 Å in wavelength and 12 × 18 µm2 in beam size), a Pilatus3S 1M area detector, an online ruby fluorescence system, and a membrane system for remote pressure control. The φ rotation is applied to the six-circle diffractometer.
    (a) Microphotograph of sample chamber after gas-loading with neon, including three ilvaite crystals and a ruby sphere. (b) Diffraction image of ilvaite collected at 20.6(2) GPa. (c) and (d) Diffraction peaks of ilvaite collected at 20.6(2) and 22.8(2) GPa, respectively, in the area outlined by the red box in (b). The peaks of two crystal domains in (d) are differentiated by different colors.
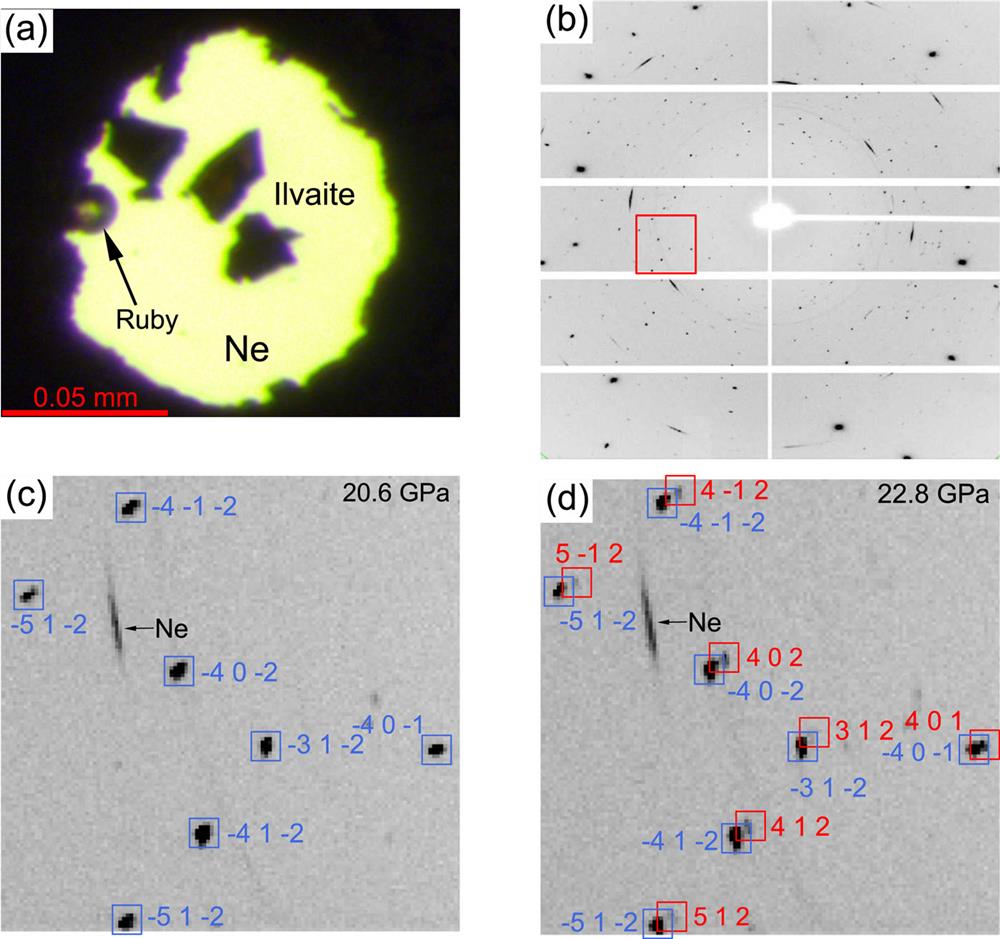
    Fig. 2. (a) Microphotograph of sample chamber after gas-loading with neon, including three ilvaite crystals and a ruby sphere. (b) Diffraction image of ilvaite collected at 20.6(2) GPa. (c) and (d) Diffraction peaks of ilvaite collected at 20.6(2) and 22.8(2) GPa, respectively, in the area outlined by the red box in (b). The peaks of two crystal domains in (d) are differentiated by different colors.
    Crystal structures of (a) ilvaite-I, (b) ilvaite-II, and (c) ilvaite-III viewed along the c axis. The red balls indicate oxygen atoms. The unit-cell edges are indicated by black frames.
    Fig. 3. Crystal structures of (a) ilvaite-I, (b) ilvaite-II, and (c) ilvaite-III viewed along the c axis. The red balls indicate oxygen atoms. The unit-cell edges are indicated by black frames.
    Unit-cell parameters of ilvaite as functions of pressure: (a) a; (b) b; (c) c; (d) β.
    Fig. 4. Unit-cell parameters of ilvaite as functions of pressure: (a) a; (b) b; (c) c; (d) β.
    (a) Unit-cell volume of ilvaite as a function of pressure. The solid lines represent a BM3 EoS fitting of the data (ilvaite-I and ilvaite-II), and the dashed lines represent an extrapolation. The EoS parameters KT0 and KT0′ are also shown. (b) FE–fE plot of ilvaite.
    Fig. 5. (a) Unit-cell volume of ilvaite as a function of pressure. The solid lines represent a BM3 EoS fitting of the data (ilvaite-I and ilvaite-II), and the dashed lines represent an extrapolation. The EoS parameters KT0 and KT0 are also shown. (b) FE–fE plot of ilvaite.
    Interatomic distances in the ilvaite structure as functions of pressure: (a) Ca–O; (b) Si1–O; (c) Si2–O. The pressure ranges of ilvaite-I, ilvaite-II, and ilvaite-III are indicated by white, gray, and red shaded regions, respectively.
    Fig. 6. Interatomic distances in the ilvaite structure as functions of pressure: (a) Ca–O; (b) Si1–O; (c) Si2–O. The pressure ranges of ilvaite-I, ilvaite-II, and ilvaite-III are indicated by white, gray, and red shaded regions, respectively.
    Interatomic distances in the ilvaite structure as functions of pressure: (a) Fe11–O; (b) Fe12–O; (c) Fe2–O. The pressure ranges of ilvaite-I, ilvaite-II, and ilvaite-III are indicated by white, gray, and red shaded regions, respectively.
    Fig. 7. Interatomic distances in the ilvaite structure as functions of pressure: (a) Fe11–O; (b) Fe12–O; (c) Fe2–O. The pressure ranges of ilvaite-I, ilvaite-II, and ilvaite-III are indicated by white, gray, and red shaded regions, respectively.
    Polyhedral distortion indices of CaO7, Si1O4, Si2O4, Fe11O6, Fe12O6, and FeO6 in the ilvaite structure as functions of pressure. The pressure ranges of ilvaite-I, ilvaite-II, and ilvaite-III are indicated by white, gray, and red shaded regions, respectively.
    Fig. 8. Polyhedral distortion indices of CaO7, Si1O4, Si2O4, Fe11O6, Fe12O6, and FeO6 in the ilvaite structure as functions of pressure. The pressure ranges of ilvaite-I, ilvaite-II, and ilvaite-III are indicated by white, gray, and red shaded regions, respectively.
    Jingui Xu, Dongzhou Zhang, Sergey N. Tkachev, Przemyslaw K. Dera. Partnership for eXtreme Xtallography (PX2)—A state-of-the-art experimental facility for extreme-conditions crystallography: A case study of pressure-induced phase transition in natural ilvaite[J]. Matter and Radiation at Extremes, 2022, 7(2): 028401
    Download Citation