
Jingui Xu, Dongzhou Zhang, Sergey N. Tkachev, Przemyslaw K. Dera. Partnership for eXtreme Xtallography (PX2)—A state-of-the-art experimental facility for extreme-conditions crystallography: A case study of pressure-induced phase transition in natural ilvaite[J]. Matter and Radiation at Extremes, 2022, 7(2): 028401
- Matter and Radiation at Extremes
- Vol. 7, Issue 2, 028401 (2022)
Abstract
I. INTRODUCTION TO THE PX2 PROGRAM
High-pressure single-crystal x-ray diffraction (SCXRD) is a unique way to determine crystal structure at elevated pressures.1–3 Compared with powder XRD, in which peak indexing can be challenging, high-pressure SCXRD has the advantage of unambiguous peak indexing. High-pressure SCXRD gives very reliable peak intensities and hence supports trustworthy crystal structure refinement, sensitive to even the most subtle changes in crystal structure. Therefore, high-pressure SCXRD is a definitive approach for crystal structure determination and is especially suitable for studying pressure-induced phase transitions, where the high-pressure phases are often complex. The diamond anvil cell (DAC) is the most successfully used pressure vessel for high-pressure SCXRD. Although with a DAC, there are limits on sample size (typical sample dimensions are 1–50 µm), very high static pressures can be reached (up to hundreds of GPa). On the other hand, the use of DACs for high-pressure SCXRD has its limitations: first, a DAC usually has a limited opening angle, which effectively limits the region of reciprocal space that can be explored; second, the diamond anvils absorb x-rays and reduce the signal-to-noise ratio of the diffraction data, which can be significant for low-energy laboratory x-ray sources. Compared with laboratory x-ray sources, synchrotron radiation x-ray sources feature high x-ray energy, short wavelength, and high flux, and hence increase the access to reciprocal space and the signal-to-noise ratio for the data, making them especially suitable for high-pressure SCXRD experiments with DACs. Synchrotron high-pressure SCXRD is used in a range of disciplines. In basic physics and chemistry, it has been used to determine the structures of simple elements at elevated pressures.4 In materials science, it has been useful in exploring pressure-induced material properties of technological interest.5 In geosciences, it has helped to understand the structure and phase composition of the Earth’s interior.6
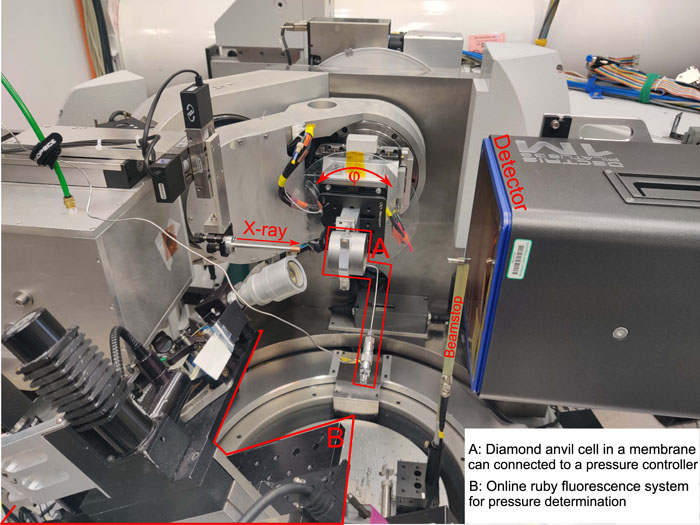
The Partnership for eXtreme Xtallography (PX2) program at the GSECARS 13-BM-C beamline of the Advanced Photon Source (APS) at the Argonne National Laboratory is dedicated to crystallographic research using a DAC-based high-pressure SCXRD technique. PX2 uses a ∼2.5 mrad fan-shaped horizontal x-ray beam provided by the APS. The x-ray beam is first focused vertically to a size of ∼18 µm (FWHM) using a Kirkpatrick–Baez mirror, then monochromated by a Rowland-circle type crystal-bending monochromator equipped with two Si crystals (111 and 311). High-pressure SCXRD experiments use the Si (311) crystal, which works at 28.6 keV. The monochromator serves as a component in the compound horizontal focusing system. The secondary horizontal focusing is accomplished using a Kirkpatrick–Baez mirror. With the compound focusing mechanism, the horizontal x-ray focus size reaches ∼12 µm (FWHM) at the sample position. High-pressure SCXRD experiments are carried out with a Newport heavy-duty six-circle kappa diffractometer, which enables four rotational degrees of freedom for the sample (φ, χ, ω, and μ) and two rotational for the detector (2θ and ν),7 maximizing access within the opening angle provided by the DAC provides. PX2 is equipped with a Si Pilatus3S 1M photon counting area detector (Dectrics), which features an adjustable x-ray energy threshold, a 20-bit dynamic range, and a 25 Hz readout rate. It is also equipped with a home-designed compact optical platform for ruby-fluorescence pressure determination, and a PACE5000 (GE) driven membrane remote pressure controller, which enables remote experiments (Fig. 1). So far, PX2 has hosted more than 100 independent groups of researchers from all countries.
![]()
Figure 1.Routine set-up for high-pressure SCXRD at PX2, including a monochromated x-ray beam (0.4340 Å in wavelength and 12 × 18
The APS is preparing for a major upgrade, which is scheduled between April 2023 and April 2024. The upgrade will introduce a new multibend achromat magnetic lattice and will double the stored current from 100 to 200 mA.8 The upgrade is expected to reduce the electron beam emittance by a factor of 70 from its present value and will increase the x-ray brightness by at least two orders of magnitude. After the APS upgrade, PX2 is expected to have a smaller beam size (potentially ∼5 µm or smaller), while maintaining a similar x-ray flux to that currently provided. It is expected that the beamline x-ray optics will be upgraded alongside the APS. It is planned to add a Si(400) crystal that works at 34.5 keV to the existing Rowland-circle monochromator, which will increase the reciprocal space probing range by 76%, given the current DAC opening angle. The increased reciprocal space probing range will significantly improve the data completeness for SCXRD, and will significantly improve the data quality and the ability to determine complex structures discovered at high pressure. It is also planned to upgrade the x-ray focusing mirrors to take advantage of the small x-ray source size after the APS upgrade and to generate a tight x-ray focus, which will help reduce sample sizes and reach higher pressures.
II. PHASE TRANSITIONS OF ILVAITE AT HIGH PRESSURE
As an example demonstrating the research capabilities at PX2, we describe in this section the pressure-induced phase transition observed in the mineral ilvaite. Ilvaite is a sorosilicate with a chemical formula CaFe2+2Fe3+SiO8(OH), which often occurs in contact with metamorphic rocks or skarn ore deposits.9 The crystal structure of natural ilvaite was determined in several early studies10–12 to be orthorhombic, with space group Pnam. However, subsequent studies13–16 suggested that natural ilvaites under room conditions are monoclinic instead of orthorhombic, with space group P21/a. The basic building blocks of the ilvaite structure include CaO7, FeO6, and SiO4 polyhedra. Two SiO4 tetrahedra form a Si2O7 dimer by corner-sharing. The FeO6 octahedra form ribbons running parallel to the c axis. There are three nonequivalent Fe sites in the ilvaite structure, Fe11O6 and Fe12O6 octahedra are connected by edge-sharing, and both are connected to Fe2O6 octahedra by corner-sharing. The FeO6 octahedral ribbons are linked together by the SiO7 dimers and CaO7 polyhedra. The monoclinic angle β of ilvaite is dependent on the distribution of Fe3+ and Fe2+ between the Fe11 and Fe12. For instance, complete disorder of Fe3+ and Fe2+ between the Fe11 and Fe12 has an orthorhombic lattice with β = 90°, while complete order of Fe3+ and Fe2+ has a monoclinic lattice with β ≈ 90.45°.13
To date, two studies have performed high-pressure XRD on natural or synthetic ilvaite, using maximum pressures were below 5 GPa. These studies suggested that ilvaite undergoes a pressure-induced monoclinic–orthorhombic (P21/a → Pnam) phase transition that is displacive and induced by electron ordering between the Fe11 and Fe12 sites; the reported transition pressures were different for ilvaites having different chemical compositions, from 1.2 to 2.25 GPa.14,15 A high-pressure Fourier transform infrared (FTIR) spectroscopy study was conducted on natural ilvaite to 31 GPa.17 In addition to the previously known P21/a → Pnam transition, this study reported pieces of evidence for two further phase transitions at 10.5 and above 20 GPa, respectively.17 However, the structures of the new phases and the mechanism of phase transitions have not yet been elucidated. Here, we present the results of a high-pressure SCXRD experiment performed on a natural ilvaite up to 30.1(1) GPa to investigate the nature of these phase transitions.
A. Sample preparation, data collection, and data processing
Natural ilvaite was used in this experiment. The sample was black and composed of columnar masses. Three crystals (∼20 to 40 µm in diameter and ∼12 µm in thickness) were extracted from a large crystal for the high-pressure SCXRD experiment. The remaining crystals were analyzed by electron probe microanalysis (Table S1,
The experiments employed a short symmetric DAC, which was equipped with two type І diamonds (300 µm culets) separately mounted on two Boehler–Almax-type tungsten carbide (WC) seats. After alignment of the two diamond anvils (the anvils were concentric and their tilt angle was minimized), a rhenium gasket was indented by the anvils to ∼43 µm thickness, and a 180 µm diameter hole was laser-drilled in the indented area to serve as the sample chamber. The three selected ilvaite crystals were loaded into the sample chamber, along with a ruby sphere (<10 µm in diameter), which was used as a pressure marker.18 Neon gas was loaded into the sample chamber as the pressure-transmitting medium using the GSECARS/COMPRESS gas-loading system.19 The sample chamber after gas-loading is shown in Fig. 2(a).
![]()
Figure 2.(a) Microphotograph of sample chamber after gas-loading with neon, including three ilvaite crystals and a ruby sphere. (b) Diffraction image of ilvaite collected at 20.6(2) GPa. (c) and (d) Diffraction peaks of ilvaite collected at 20.6(2) and 22.8(2) GPa, respectively, in the area outlined by the red box in (b). The peaks of two crystal domains in (d) are differentiated by different colors.
The prepared DAC was placed into the membrane system and fixed in a clamp-type holder. The holder was then mounted onto the diffractometer sample stage. Sample alignment was achieved by using direct beam absorption monitored by a photodiode,3 which put the sample chamber on the rotational center of the diffractometer. The opening angle of the DAC accessible to the x-rays, measured by a φ scan combined with direct beam absorption, was from 65°.
During the data collection, the step scans were performed by φ rotation, the step size was 1°, and the exposure time was 2 s/°. At PX2, multiple detector positions can be realized by changing the angles δ and ν,3 but we collected data at only one detector position in this study, since this was sufficient for structural determination. Data reduction was performed with the Bruker APEX3 software suite. The structural determination and refinement were performed using the Shelx software package20 facilitated by the Olex2 user interface.21 We refined the structure of ilvaite using the pure chemical formula CaFe2+2Fe3+Si2O7O(OH), since other chemical components were very minor (Table S1,
The pressure in the sample chamber was determined by collecting the ruby fluorescence spectra before and after sample data collection, and the average value was used for each data point. After collection of the sample data, the pressure was increased using the remote control membrane system to the maximum pressure of 30.1(1) GPa in 20 pressure steps. Then, the DAC was taken out of the membrane system, followed by a data collection at 27.8(1) GPa. Data from only one of the ilvaite crystals are shown in this paper to ensure consistency.
B. Results
1. Phase transitions in ilvaite
The SCXRD data collected at room pressure indicated that this natural ilvaite sample was monoclinic, with space group P21/a. The lattice parameters were obtained as a = 12.9961(8) Å, b = 8.829(4) Å, c = 5.8567(4) Å, and β = 90.13(1)° (Table S2,
![]()
Figure 3.Crystal structures of (a) ilvaite-I, (b) ilvaite-II, and (c) ilvaite-III viewed along the
The ilvaite remained in the ilvaite-II structure until the pressure was increased to 22.8(2) GPa, where a phase transition was indicated by a change in the SCXRD image. As shown in Fig. 2, at 20.6(2) GPa, the collected peaks were well indexed with an orthorhombic unit cell; however, new peaks emerged at 22.8(2) GPa, indicating a structural change [Fig. 2(c)]. Peak indexing resulted in two monoclinic twinning unit cells, and the unit-cell parameters of these two unit cells were refined as a = 12.5480(30) Å, b = 8.523(11) Å, c = 5.5381(12) Å, and β = 90.78(2)°, and as a = 12.5000(180) Å, b = 8.540(60) Å, c = 5.5230(60) Å, and β = 90.20(10)°, respectively (Table S2,
2. Equation of state
The unit-cell parameters a, b, and c decreased continuously through the first phase transition, but the angle β jumped to 90° (Fig. 3). With increasing pressure, the compression behaviors of a and b changed, showing that a softened and b became less compressible between 18.6(2) and 20.6(2) GPa, while the compression of c was still continuous [Figs. 4(a)–4(c)]. In the second phase transition, a and c decreased continuously, while b became more compressible and continuously decreased until the maximum pressure was reached. The angle β increased from 90° through the second phase transition and continued increasing until the maximum pressure was reached.
![]()
Figure 4.Unit-cell parameters of ilvaite as functions of pressure: (a)
The volume compression was smooth through the first phase transition, but a volume drop (0.4%) occurred through the second phase transition [Fig. 5(a)]. It is interesting to note that the discontinuities in the compression of a and b within 18.6(2)–20.6(2) GPa did not cause any pronounced change in volume compression within the same pressure range. We fitted the P–V (volume) data [from room pressure up to 20.6(2) GPa] to the third-order Birch–Murnaghan equation of state (BM3 EoS) to obtain the EoS parameters,22 including the zero-pressure isothermal bulk modulus KT0 and its pressure derivative
![]()
Figure 5.(a) Unit-cell volume of ilvaite as a function of pressure. The solid lines represent a BM3 EoS fitting of the data (ilvaite-I and ilvaite-II), and the dashed lines represent an extrapolation. The EoS parameters
The dependence of the normalized stress FE = P/[3fE(2fE + 1)5/2]23 on the volume Eulerian finite strain fE = [(V0/V)2/3 − 1]/2 is shown in Fig. 5(b). This fE–FE plot exhibits distinct regions of compression behavior, which is very similar to the change in compressional mechanism observed in natural aegirine.24 At low strains [from room pressure up to 20.6(2) GPa], the data have a positive slope, whereas data at high strains [22.8(2)–30.1(1) GPa] display a negative slope.
3. Polyhedral compression
The results of refinements (Table S4,
![]()
Figure 6.Interatomic distances in the ilvaite structure as functions of pressure: (a) Ca–O; (b) Si1–O; (c) Si2–O. The pressure ranges of ilvaite-I, ilvaite-II, and ilvaite-III are indicated by white, gray, and red shaded regions, respectively.
![]()
Figure 7.Interatomic distances in the ilvaite structure as functions of pressure: (a) Fe11–O; (b) Fe12–O; (c) Fe2–O. The pressure ranges of ilvaite-I, ilvaite-II, and ilvaite-III are indicated by white, gray, and red shaded regions, respectively.
![]()
Figure 8.Polyhedral distortion indices of CaO7, Si1O4, Si2O4, Fe11O6, Fe12O6, and FeO6 in the ilvaite structure as functions of pressure. The pressure ranges of ilvaite-I, ilvaite-II, and ilvaite-III are indicated by white, gray, and red shaded regions, respectively.
For the CaO7 polyhedron, from room pressure to 0.4(1) GPa, ilvaite-I transformed to ilvaite-II, the Ca–O3 interatomic distance decreased by 0.8%, while Ca–O7 increased by 1.3%, and others did not change observably within the uncertainty [Fig. 6(a)]. In the stable range of ilvaite-II, as the pressure increased from 0.4(1) to 16.3(1) GPa, Ca–O2, Ca–O3, Ca–O4, Ca–O5, and Ca–O7 were decreased by 2.7%, 1.5%, 2.7%, 5.2%, and 2.8%, respectively [Fig. 6(a) and Table S5 (
The SiO4 tetrahedra were much more incompressible than the CaO7 polyhedron. As shown in Figs. 6(b) and 6(c), from room pressure to 16.3(1) GPa, the Si1–O and Si2–O distances remained almost unchanged within the uncertainty. After 16.3(1) GPa, two abrupt changes occurred in the Si1–O distances, as shown in Fig. 6(b), Si1–O5 increased by 3.2% as the pressure increased from 16.3(1) to 18.6(2) GPa, and Si1–O21 decreased by 6.8% from 20.6(2) to 22.8(2) GPa. Likewise, abrupt changes occurred in the Si2–O distances above 16.3(1) GPa. As shown in Fig. 6(c), Si2–O5 decreased by 8.5% as the pressure increased from 16.3(1) to 18.6(2) GPa, and it decreased by 6.3% from 20.6(2) to 22.8(2) GPa; Si2–O3 decreased by 6.2% from 16.3(1) to 20.6(2) GPa, then it increased by 8.6% from 20.6(2) to 22.8(2) GPa; Si2–O42 decreased by 6.2% from 20.6(2) to 22.8(2) GPa. As the pressure increased above 22.8(2) GPa, the Si–O distances increased to become comparable to the values within the pressure range from room pressure up to 16.3(1) GPa.
In the first phase transition, the Fe11–O1a, Fe11–O1b, Fe11–O3, Fe11–O41, and Fe11–O7 distances decreased by 1.7%, 0.3%, 0.9%, 0.1%, and 1.4%, respectively, while Fe11–O21 increased by 0.2%; Fe12–O1a, Fe12–O22, and Fe12–O42 decreased by 0.4%, 0.6%, and 0.9% [Fig. 7(a)], respectively, while Fe12–O1b, Fe12–O3, and Fe12–O7 increased by 1.6%, 0.3%, and 0.1% respectively [Fig. 7(b)]. In ilvaite-II, Fe11 and Fe12 are identical and thus merged into Fe1. As the pressure increased from 0.4(1) to 16.3(1) GPa, Fe1–O1a, Fe1–O1b, Fe1–O22, Fe1–O3, Fe1–O42, and Fe1–O7 decreased by 1.5%, 4.8%, 2.2%, 2.6%, 3.3%, and 1.3%, respectively. From 16.3(1) to 20.6(2) GPa, Fe1–O1a, Fe1–O22, Fe1–O42, and Fe1–O3 became hardened and increased by 0.5%, 2.0%, 2.1%, and 3.2%, respectively, while Fe1–O1b and Fe1–O7 decreased by 1.7% and 0.6%, respectively. From 20.6(2) to 22.8(2) GPa, ilvaite-II transformed into ilvaite-III, Fe11–O1a and Fe11–O41 decreased by 2.6% and 2.4%, respectively, while Fe11–O1b, Fe11–O21, Fe11–O3, and Fe11–O7 increased by 1.9%, 0.6%, 4.7%, and 2.4%, respectively; Fe12–O1a increased by 1.3%, while Fe12–O1b, Fe12–O22, Fe12–O42, Fe12–O3, and Fe12–O7 decreased by 6.4%, 3.3%, 2.0%, 4.3%, and 5.3%, respectively. As the pressure increased from 22.8(2) to 30.1(1) GPa, Fe11–O1a and Fe11–O7 increased by 3.6% and 2.0%, respectively, while Fe11–O1b, Fe11–O21, Fe11–O3, and Fe11–O41 decreased by 2.9%, 4.9%, 5.9%, and 2.0%, respectively [Fig. 6(a)]; within the same pressure range, Fe12–O1a and Fe12–O42 decreased by 2.9% and 3.9%, respectively, and Fe12–O1b and Fe12–O7 increased by 1.6% and 4.3%, respectively, while Fe12–O22 and Fe12–O3 did not change significantly within the uncertainty [Fig. 7(b)].
In comparison with the Fe11–O and Fe12–O distances, the compression of Fe2–O was more continuous through the first phase transition [Fig. 7(c)]. In the pressure range of ilvaite-II, as the pressure increased from 0.4(1) to 16.3(1) GPa, Fe2–O1, Fe2–O4, and Fe2–O6 decreased by 1.6%, 4.7%, and 2.2%, respectively, and inflections occurred within the range 16.3(1)–20.6(2) GPa, where Fe2–O1 and Fe2–O6 increased by 2.6% and 1.8%, respectively, and Fe2–O4 decreased by 3.8%. Fe2–O2 decreased by 5.5% as the pressure increased from 0.4(1) to 18.6(2) GPa; from 18.6(2) to 20.6(2) GPa, it increased by 0.9%. As the pressure increased from 20.6(2) to 22.8(2) GPa, ilvaite-II transformed into ilvaite-III, Fe2–O1 and Fe2–O22 decreased by 2.3% and 1.8%, respectively, while Fe2–O21, Fe–O41, Fe2–O42, and Fe2–O6 increased by 7.6%, 4.3%, 5.3%, and 2.6%, respectively. For ilvaite-III, as the pressure increased from 22.8(2) to 30.1(1) GPa, Fe2–O1 and Fe2–O22 did not change significantly within the uncertainty, whereas Fe2–O21, Fe2–O41, Fe2–O42, and Fe2–O6 decreased by 8.3%, 4.1%, 5.0%, and 4.0%, respectively [Fig. 7(c)].
The compression of the mean Ca–O, Si–O, and Fe–O distances exhibited discontinuities. As shown in Fig. 6(a), as the pressure increased from room pressure to 20.6(2) GPa, the mean Ca–O distance steadily decreased at an average rate of 0.004 Å/GPa, whereas it decreased at a much faster rate (0.025 Å/GPa) as ilvaite-II transformed into ilvaite-III as the pressure increased from 20.6(2) to 22.8(2) GPa, above 22.8(2) GPa, it decreased at a moderate rate of 0.004 Å/GPa, which was comparable to the rate of decrease before the ilvaite-II → ilvaite-III transition. The compression of the mean Si–O distances behaved similarly: as shown in Figs. 6(b) and 6(c), the mean Si1–O and Si2–O distances exhibited a distinct drop between 18.6(2) and 22.8(2) GPa, while at other pressures their compressions were not pronounced. The compressions of the mean Fe11–O and Fe12–O distances were continuous as the pressure increased from room pressure to 16.3(1) GPa. From 16.3(1) to 18.6(2) GPa, the mean Fe11–O and Fe12–O distances increased by 1.7%. Through the ilvaite-II → ilvaite-III transition, the mean Fe11–O distance increased by 0.8% [Fig. 7(a)], while the mean Fe12–O distance decreased by 3.3% [Fig. 7(b)]. The mean Fe2–O distance decreased continuously from room pressure to 20.6(2) GPa, and it increased by 2.6% through the ilvaite-II → ilvaite-III transition [Fig. 7(c)].
The polyhedral distortion indices26D for ilvaite at various pressures were calculated and are shown in Fig. 8 and Tables S5–S8 (
C. Discussion
The pressure-induced ilvaite-I → ilvaite-II phase transition has been confirmed by several studies using various techniques, including XRD, Fourier transform infrared (FTIR), and Mossbauer spectroscopy.14,15,17,27 Electron hopping between Fe11 and Fe12 at high pressure was suggested as being responsible for this phase transition. The pressure of this phase transition was determined to lie in the range 1.2–2.5 GPa. Finger and Hazen14 suggested that ilvaite that has a smaller initial magnitude of the monoclinic angle transforms to ilvaite-II at a lower pressure. This is consistent with the experimental results. A phase transition of pure ilvaite (β = 90.26°) was observed at 2.25 GPa by Ghazi-Bayat et al.,15 whereas Finger and Hazen14 reported a phase transition of a natural ilvaite (β = 90.11°) at 1.2 GPa. In the present study, the monoclinic angle [β = 90.13(1)°] of the natural ilvaite is comparable to that of the ilvaite reported by Finger and Hazen,14 and the phase transition was observed at 0.4(1) GPa, which was lower than that reported by Finger and Hazen.14 However, Finger and Hazen14 did not collect data between room pressure and 1.2 GPa, and thus the pressure of the phase transition that they obtained was likely overestimated.
The ilvaite-II → ilvaite-III phase transition was observed at 22.8(2) GPa, as indicated by the change in diffraction images (Fig. 2). The pressure of this phase transition observed in this study is consistent with the FTIR results (at >20 GPa) reported by Koch-Müller et al.17 This phase transition was accompanied by the appearance of twining (Fig. 2), which is very similar to what occurs during the pressure-induced α-opx → β-opx phase transition of orthopyroxene.6,28–31 As shown in Fig. 3, the structures of ilvaite-I, ilvaite-II, and ilvaite-III are very similar to each other, and the cation–oxygen linkages are nearly consistent in their structures. However, unlike ilvaite-I, the monoclinic angle of ilvaite-III [β = 90.78(2)° at 22.8(2) GPa] is much larger, making the monoclinic characteristic much more easily recognizable in ilvaite-III than in ilvaite-II. Unlike the ilvaite-I → ilvaite-II phase transition, which is not a first-order phase transition, since there is no discontinuity in the compression of unit-cell volume14,15 [Fig. 5(a)], the ilvaite-II → ilvaite-III phase transition is a first-order phase transition, since such a discontinuity does occur [Fig. 5(a)]. Moreover, the unit-cell volume compression curve [Fig. 5(a)] and the fE–FE plot [Fig. 5(b)] indicate that ilvaite-III is more compressible than ilvaite-II.
It is worth noting that in addition to the ilvaite-I → ilvaite-II and ilvaite-II → ilvaite-III phase transitions, an anomaly occurred in the compressions of the unit-cell parameters a and b at 18.6(2) GPa. As shown in Figs. 4(a) and 4(b), the compressions of a and b between 18.6(2) and 20.6(2) GPa deviated from their compression trends between 0.4(1) and 16.3(1) GPa, with a being softened and b hardened. This anomaly indicated a change in structural compression, though this change did not cause anomalies in the volume compression within this pressure range [Fig. 5(a)]. The anomaly in the compression of a and b could be associated with the change in the compression of the Fe2O6 octahedra. At pressures between room pressure and 16.3(1) GPa, the Fe2O6 octahedron is highly distorted (Fig. 8) compared with other polyhedra, which can be explained by the Jahn–Teller effect.11 However, as shown in Fig. 7(c), from 16.3(1) to 18.6(2) GPa, the interatomic distance Fe2–O4 abruptly dropped by 3.7%, while Fe2–O6 increased by 3.3%, and other Fe2–O distances changed along their compression tracks. This change in the compression of the Fe2O6 octahedra caused a 51% decrease in octahedral distortion, making the distortion of Fe2O6 comparable to those of other polyhedra (Fig. 8), owing to the respective decrease and increase of the maximum (Fe2–O4) and minimum (Fe2–O6) Fe2–O distances [Fig. 7(c)]. This decrease in polyhedral distortion at 18.6(2) GPa indicates a pressure-induced suppression of the Jahn–Teller effect17 of the octahedra. Such a change in Fe2O6 distortion could be associated with a magnetic transition, as suggested by Xuemin et al.,32 who carried out low-temperature Mossbauer spectroscopy of ilvaite and concluded that the magnetic transition of ilvaite at 36 K is associated with a significant change in Fe2O6 distortion. Therefore, the reduction in Fe2O6 distortion at 18.6(2) GPa is likely associated with a pressure-induced magnetic transition, like the temperature-induced magnetic transition of ilvaite observed at 36 K.
Koch-Müller et al.17 reported another phase transition at 10.5 GPa based on their high-pressure FTIR data in addition to the ilvaite-I → ilvaite-II and ilvaite-II → ilvaite-III phase transitions. They argued that this phase transition is likely associated with a suppression of the Jahn–Teller effect of the strongly distorted Fe2O6 octahedra. However, in the present study, as shown in Fig. 8, no abrupt change occurred at ∼10 GPa in the Fe2O6 distortion; instead, the distortion–pressure slope changed at 9.7(2) GPa. From room pressure to 9.7(2) GPa, the distortion of Fe2O6 decreased at a rate of 0.0017 GPa−1, whereas from 9.7(2) to 16.3(1) GPa, it increased at a rate of 0.0003 GPa−1. Therefore, the phase transition at 10.5 GPa could not reflect suppression of the Jahn–Teller effect. In the present study, this structural change in ilvaite-II did not cause any anomalies in the diffraction images, unit-cell parameters, or EoS, but was in accordance with the inflection at 9.7(2) GPa in the compression curve of Fe2O6 distortion (Fig. 8). This pressure-induced minor structural change of ilvaite-II might be associated with another magnetic transition, such as the temperature-induced magnetic transition observed at ∼120 K.33,34
III. SUMMARY
We have described in situ high-pressure SCXRD at the PX2 program, together with a case study of the phase transitions of ilvaite at high pressure. The results revealed pressure-induced ilvaite-I → ilvaite-II → ilvaite-III phase transitions and two minor structural modifications embodied in the abnormal compression behaviors of the Fe2O6 octahedra, and they also enabled the EoS of the mineral to be obtained. Thus, the quality of the high-pressure SCXRD data collected at PX2 is such that it can be used for precise determination of unit-cell parameters, for location of pressure-induced phase transitions, for solution of the crystal structures of high-pressure polymorphs, even in low-symmetry (monoclinic) cases with twinning domains, and for analyzing minor structural modifications of polyhedral geometries at high pressure.
SUPPLEMENTARY MATERIAL
ACKNOWLEDGMENTS
Acknowledgment. This work was performed at GeoSoilEnviroCARS (The University of Chicago, Sector 13), Partnership for Extreme Crystallography (PX2) program, Advanced Photon Source (APS), and Argonne National Laboratory. The PX2 program is supported by COMPRES under NSF Cooperative Agreement No. EAR 11-57758. The use of the COMPRES-GSECARS gas loading system was supported by COMPRES under NSF Cooperative Agreement No. EAR 11-57758 and by GSECARS. GeoSoilEnviroCARS is supported by the National Science Foundation–Earth Sciences (Grant No. EAR-1634415) and Department of Energy–GeoSciences (Grant No. DE-FG02-94ER14466). This research used resources of the Advanced Photon Source, a U.S. Department of Energy (DOE) Office of Science User Facility operated for the DOE Office of Science by Argonne National Laboratory under Contract No. DE-AC02-06CH11357. We would like to thank the Editor, Associate Editor, and two reviewers for their valuable comments and suggestions that greatly improved the manuscript.
References
[1] S. M.Clark, P.Dera, R. T.Downs, G. J.Finkelstein, O.Grubor-Urosevic, V.Prakapenka, M. L.Rivers, O.Tschauner, K.Zhuravlev. High pressure single-crystal micro X-ray diffraction analysis with GSE_ADA/RSV software. High Pressure Res., 33, 466(2013).
[2] P.Dera, R. T.Downs, B.Lavina. Modern X-ray diffraction methods in mineralogy and geosciences. Rev. Mineral. Geochem., 78, 1(2014).
[3] P. K.Dera, P. J.Eng, V. B.Prakapenka, M. L.Rivers, J. E.Stubbs, D.Zhang, J. S.Zhang. High pressure single crystal diffraction at PX2. J. Visualized Exp., 119, 54660(2017).
[4] S.Desgreniers, P.Loubeyre, L. F.Lundegaard, M. I.McMahon, G.Weck. Observation of an O8 molecular lattice in the ε phase of solid oxygen. Nature, 443, 201(2006).
[5] J.-K.Bao, W.Cai, D. Y.Chung, J.Coles, K. P.Hilleke, M. G.Kanatzidis, W.Lin, J.Xu, Y.Yan, D.Zhang. Pressure-induced superconductivity in the wide-band-gap semiconductor Cu2Br2Se6 with a robust framework. Chem. Mater., 32, 6237(2020).
[6] P.Dera, R. T.Downs, T. S.Duffy, G. J.Finkelstein, Y.Meng, V.Prakapenka, S.Tkachev. Metastable high-pressure transformations of orthoferrosilite Fs82. Phys. Earth Planet. Inter., 221, 15(2013).
[7] H. B.Larsen, R. H.Mathiesen, G.Thorkildsen. Angle calculations for a six-circle
[8] E.Austin. Advanced photon source. Synchrotron Radiat. News, 29, 29(2016).
[9] M. B.Franchini, L. D.Meinert, J. M.Vallés. First occurrence of ilvaite in a gold skarn deposit. Econ. Geol., 97, 1119(2002).
[10] N.Belov, V.Mokeeva. Kristallicheskaya struktura ilvaita. Tr. Inst. Kristallogr., Akad. Nauk SSSR, 9, 47(1954).
[11] A.Beran, H.Bittner. Untersuchungen zur kristallchemie des ilvaits. Tschermaks Mineral. Petrogr. Mitt., 21, 11(1974).
[12] N.Haga, Y.Takéuchi. Neutron diffraction study of ilvaite. Z. Kristallogr. -Cryst. Mater., 144, 161(1976).
[13] M.Bunno, N.Haga, Y.Takéuchi. X-ray study on polymorphism of ilvaite, HCaFe22+Fe3+O2[Si2O7]. Z. Kristallogr. -Cryst. Mater., 163, 267(1983).
[14] L.Finger, R.Hazen. Crystal structure of monoclinic ilvaite and the nature of the monoclinic-orthorhombic transition at high pressure. Z. Kristallogr., 179, 415(1987).
[15] H.Ahsbahs, G.Amthauer, B.Ghazi-Bayat. High pressure X-ray diffraction study of ilvaite CaFe22+Fe3+[Si2O7O(OH)]. Phys. Chem. Miner., 20, 402(1993).
[16] L.Bindi, P.Bonazzi. Structural adjustments induced by heat treatment in ilvaite. Am. Mineral., 84, 1604(1999).
[17] M.Gottschalk, M.Koch-Müller, M.Mrosko, U.Schade. Pressure-induced phase transitions in ilvaite studied by in situ micro-FTIR spectroscopy. Eur. J. Mineral., 24, 831(2012).
[19] C. M.Holl, S. D.Jacobsen, A.Kubo, V. B.Prakapenka, C.Pullins, M.Rivers. The COMPRES/GSECARS gas-loading system for diamond anvil cells at the Advanced Photon Source. High Pressure Res., 28, 273(2008).
[20] G. M.Sheldrick. A short history of SHELX. Acta Crystallogr., Sect. A: Found. Crystallogr., 64, 112(2008).
[21] L. J.Bourhis, O. V.Dolomanov, R. J.Gildea, J. A.Howard, H.Puschmann. OLEX2: A complete structure solution, refinement and analysis program. J. Appl. Crystallogr., 42, 339(2009).
[22] M.Alvaro, R. J.Angel, J.Gonzalez-Platas. EosFit7c and a Fortran module (library) for equation of state calculations. Z. Kristallogr. -Cryst. Mater., 229, 405(2014).
[23] R. J.Angel. Equations of state. Rev. Mineral. Geochem., 41, 35(2000).
[25] F.Izumi, K.Momma. VESTA 3 for three-dimensional visualization of crystal, volumetric and morphology data. J. Appl. Crystallogr., 44, 1272(2011).
[26] W.Baur. The geometry of polyhedral distortions. Predictive relationships for the phosphate group. Acta Crystallogr., Sect. B: Struct. Sci., 30, 1195(1974).
[27] G.Amthauer, B.Evans. The electronic structure of ilvaite and the pressure and temperature dependence of its 57Fe Mössbauer spectrum. J. Phys. Chem. Solids, 41, 985(1980).
[30] J. D.Bass, P.Dera, J. S.Zhang. A new high-pressure phase transition in natural Fe-bearing orthoenstatite. Am. Mineral., 97, 1070(2012).
[31] P. K.Dera, T. S.Duffy, G. J.Finkelstein. Phase transitions in orthopyroxene (En90) to 49 GPa from single-crystal X-ray diffraction. Phys. Earth Planet. Inter., 244, 78(2015).
[32] B. D.Dunlap, S.Ghose, K.Xuemin. Phase transitions in ilvaite, a mixed-valence iron silicate I. A 57Fe Mössbauer study of magnetic order and spin frustration. Phys. Chem. Miner., 16, 55(1988).
[33] Y.Takéuchi, T.Yamanaka. Mössbauer spectra and magnetic features of ilvaites. Phys. Chem. Miner., 4, 149(1979).
[34] S.Ghose, A.Hewat, M.Marezio. A neutron powder diffraction study of the crystal and magnetic structures of ilvaite from 305 K to 5 K—A mixed valence iron silicate with an electronic transition. Phys. Chem. Miner., 11, 67(1984).


Set citation alerts for the article
Please enter your email address

© Copyright 2018-2021 | Chinese Laser Press. All Rights Reserved 沪ICP备15018463号-20