• Spectroscopy and Spectral Analysis
  • Vol. 42, Issue 7, 2241 (2022)
Chong WANG, Huan DU, Jing WANG, Jing WANG, and Jing-hua WANG
Author Affiliations
  • School of Electronic Engineering, Xi’an University of Posts and Telecommunications, Xi’an 710121, China
  • show less
    DOI: 10.3964/j.issn.1000-0593(2022)07-2241-06 Cite this Article
    Chong WANG, Huan DU, Jing WANG, Jing WANG, Jing-hua WANG. Using Fiber Grating Cascade Structure to Realize Fiber Delay Line[J]. Spectroscopy and Spectral Analysis, 2022, 42(7): 2241 Copy Citation Text show less
    Block diagram of system
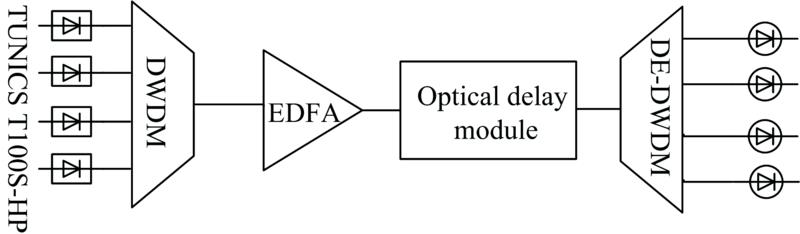
    Fig. 1. Block diagram of system
    Block diagram of optical delay module
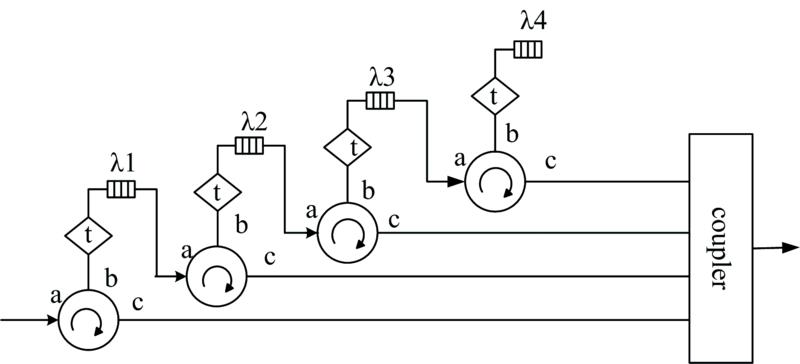
    Fig. 2. Block diagram of optical delay module
    Optical fiber reel
    Fig. 3. Optical fiber reel
    Schematic diagram of fiber grating
    Fig. 4. Schematic diagram of fiber grating
    Reflectance spectrum of center wavelength 1 550, 1 551, 1 552 and 1 553 nm
    Fig. 5. Reflectance spectrum of center wavelength 1 550, 1 551, 1 552 and 1 553 nm
    Six apodization function apodization diagram(a): Blackman function; (b): Sinc function; (c): Tanh function; (d): Hamming function; (e): Gauss function; (f): Cauchy function
    Fig. 6. Six apodization function apodization diagram
    (a): Blackman function; (b): Sinc function; (c): Tanh function; (d): Hamming function; (e): Gauss function; (f): Cauchy function
    Variation of fiber loss with radius under different working wavelengths
    Fig. 7. Variation of fiber loss with radius under different working wavelengths
    Waveform test system
    Fig. 8. Waveform test system
    Waveforms of different transmission distances when the output frequency is 2 000 Hz
    Fig. 9. Waveforms of different transmission distances when the output frequency is 2 000 Hz
    Block diagram of the test system
    Fig. 10. Block diagram of the test system
    The power difference relative to the straight optical fiber when the output frequency is 2 000 Hz
    Fig. 11. The power difference relative to the straight optical fiber when the output frequency is 2 000 Hz
    Apodization functionExpressionParameter valueAnalysis result
    Blackman functionf(z)=1+(1+D)cos2πzL+Dcos4πzL2(1+D)D=0.18The side lobes are not eliminated completely, and the reflection spectrum is deviated seriously from the center wavelength
    Sinc functionf(z)=sincA122zLBA=2
    B=6
    The side lobes are not eliminated completely, and the reflection spectrum deviates from the center wavelength
    Tanh functionf(z)=1+tanhβ(1-22zLα)α=1
    β=1
    Most of the side lobes are eliminated, but the top envelope is reduced
    Hamming functionf(z)=1+Hcos2πzL1+HH=0.8Basically eliminate the reflection spectrum side lobes to achieve the effect of filtering side lobes, but the reflection spectrum envelope is severely reduced
    Gauss functionf(z)=e-G(z2)2G=8Completely eliminate side lobes, and reduce the envelope at the top of the reflection spectrum, and have the better results
    Cauchy functionf(z)=1-2zL21-2CzL2C=0.5Completely eliminate the side lobes, have little effect on the envelope, and have the best effect
    Table 1. Comparison of different apodization functions
    Chong WANG, Huan DU, Jing WANG, Jing WANG, Jing-hua WANG. Using Fiber Grating Cascade Structure to Realize Fiber Delay Line[J]. Spectroscopy and Spectral Analysis, 2022, 42(7): 2241
    Download Citation