• Journal of Infrared and Millimeter Waves
  • Vol. 40, Issue 6, 840 (2021)
Tian-Ye WANG1, Qi-Lai FEI1、2, Bo XU1, Yan LIANG1、*, and He-Ping ZENG1、2、3
Author Affiliations
  • 1School of Optical-Electrical and Computer Engineering,University of Shanghai for Science and Technology,Shanghai 200093,China
  • 2Chongqing Institute of East China Normal University,Chongqing 401147,China
  • 3State Key Laboratory of Precision Spectroscopy,East China Normal University,Shanghai 200062,China
  • show less
    DOI: 10.11972/j.issn.1001-9014.2021.06.019 Cite this Article
    Tian-Ye WANG, Qi-Lai FEI, Bo XU, Yan LIANG, He-Ping ZENG. GHz InGaAs/InP single-photon detector with tunable repetition frequencies[J]. Journal of Infrared and Millimeter Waves, 2021, 40(6): 840 Copy Citation Text show less
    APD test chart in linear mode
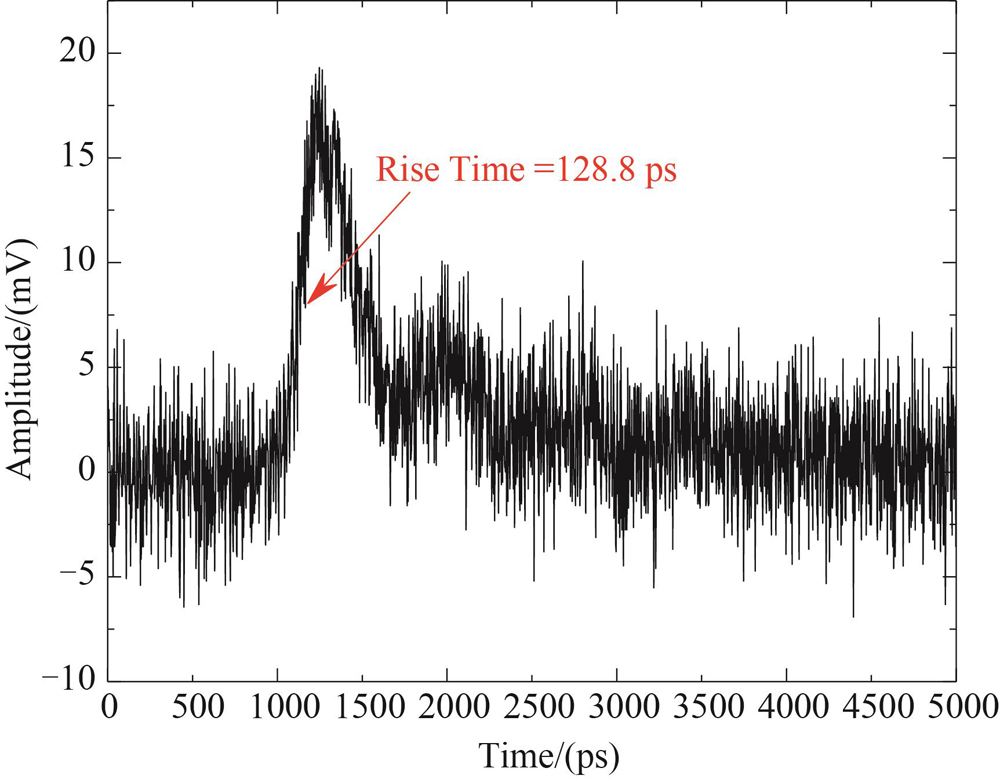
    Fig. 1. APD test chart in linear mode
    (a)Physical image of the detector,(b)Schematic setup of the detector Note:FPGA:Field programmable gate array,PGC:Pulse generating circuit,DCC:Delay chip circuit,HVC:High voltage circuit,PID:Temperature control circuit,VA:Voltage controlled attenuator,AMP:RF amplifier,HPF:High pass filter,LD:Laser,Atten:Optical attenuator,LPF:Low pass filter,PSC:Pulse shaping circuit
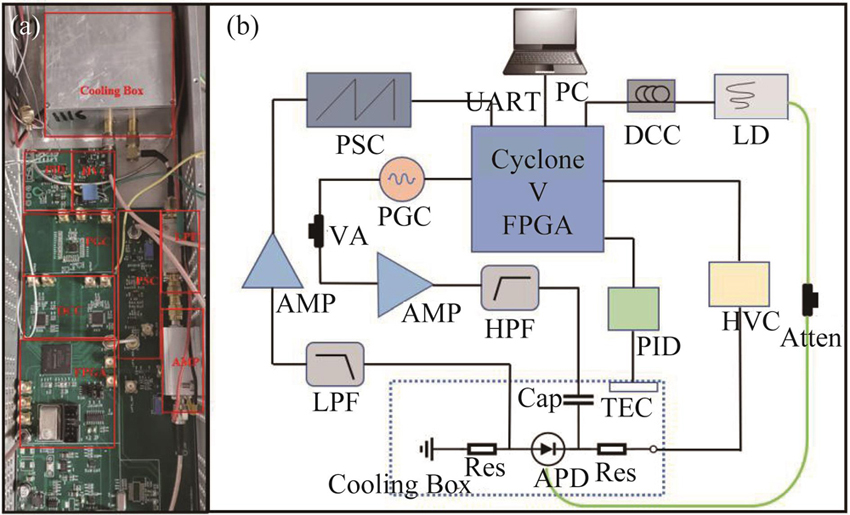
    Fig. 2. (a)Physical image of the detector,(b)Schematic setup of the detector Note:FPGA:Field programmable gate array,PGC:Pulse generating circuit,DCC:Delay chip circuit,HVC:High voltage circuit,PID:Temperature control circuit,VA:Voltage controlled attenuator,AMP:RF amplifier,HPF:High pass filter,LD:Laser,Atten:Optical attenuator,LPF:Low pass filter,PSC:Pulse shaping circuit
    ADF4351 output matching circuit scheme
    Fig. 3. ADF4351 output matching circuit scheme
    Phase noise test chart at each repetition frequency
    Fig. 4. Phase noise test chart at each repetition frequency
    Schematic diagram of the waveform of the combined action of the bias voltage and the gate signal
    Fig. 5. Schematic diagram of the waveform of the combined action of the bias voltage and the gate signal
    Output counts of the detector at different detection efficiencies Note:Sinusoidal gated signal with a repetition frequency of 1 GHz (a)5% detection efficiency total counts,(b)5% detection efficiency dark counts,(c)10% detection efficiency total counts,(d)10% detection efficiency dark counts,(e)15% detection efficiency total counts,(f)15% detection efficiency dark counts,(g)20% detection efficiency total counts,(h)20% detection efficiency dark counts
    Fig. 6. Output counts of the detector at different detection efficiencies Note:Sinusoidal gated signal with a repetition frequency of 1 GHz (a)5% detection efficiency total counts,(b)5% detection efficiency dark counts,(c)10% detection efficiency total counts,(d)10% detection efficiency dark counts,(e)15% detection efficiency total counts,(f)15% detection efficiency dark counts,(g)20% detection efficiency total counts,(h)20% detection efficiency dark counts
    (a)APD output signal waveform at 1500 MHz gate frequency,(b)avalanche signal after low-pass filter and amplification,(c)avalanche signal count rate under different repetition frequency without light,(d)detector working at each frequency with 10% detection efficiency for 2 hours
    Fig. 7. (a)APD output signal waveform at 1500 MHz gate frequency,(b)avalanche signal after low-pass filter and amplification,(c)avalanche signal count rate under different repetition frequency without light,(d)detector working at each frequency with 10% detection efficiency for 2 hours

    频率

    (GHz)

    100 Hz(dBc/Hz)1.00 kHz(dBc/Hz)10.0 kHz(dBc/Hz)100 kHz(dBc/Hz)1.00 MHz(dBc/Hz)
    1.00-78.93-87.49-85.77-96.19-133.34
    1.25-74.25-83.51-80.97-89.75-130.50
    1.50-68.62-81.93-79.92-89.39-132.87
    1.75-69.82-79.99-77.50-87.80-127.31
    2.00-66.38-79.02-77.14-85.23-129.44
    Table 1. Phase noise test table for each repetition frequency
    频率/GHzADF4351输出门控信号幅度/mV经过放大器放大后的幅度/V衰减1dB后的幅度/V衰减2dB后的幅度/V衰减3dB后的幅度/V
    1.0023914.713.211.510.5
    1.2520112.211.310.39.4
    1.5022015.014.112.311.2
    1.7525611.010.38.57.7
    2.0028913.512.110.69.8
    Table 2. The amplitude of each repetition frequency through the amplifier and adjustable attenuator
    探测效率/(%)偏置电压/V暗计数率/门-1
    560.7280.50×10-6
    1061.0190.72×10-6
    1561.4481.50×10-6
    2062.0882.95×10-6
    Table 3. Bias voltage and dark count rate corresponding to each detection efficiency
    Tian-Ye WANG, Qi-Lai FEI, Bo XU, Yan LIANG, He-Ping ZENG. GHz InGaAs/InP single-photon detector with tunable repetition frequencies[J]. Journal of Infrared and Millimeter Waves, 2021, 40(6): 840
    Download Citation