
Zicong WEN, Dechao NIU, Yongsheng LI. Silver Clusters-loaded Silica-based Hybrid Nanoparticles: Synthesis and SERS Performance[J]. Journal of Inorganic Materials, 2021, 36(12): 1297
- Journal of Inorganic Materials
- Vol. 36, Issue 12, 1297 (2021)
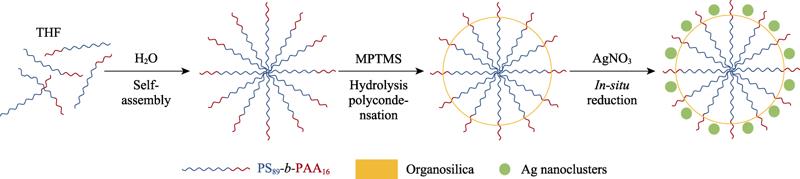
. Schematic illustration for the fabrication of Ag@SHNPs
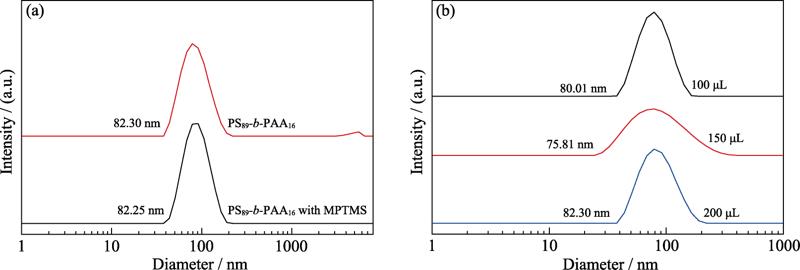
. (a) Hydrodynamic diameter distributions of PS89-b- PAA16 micelles and SHNPs, and (b) hydrodynamic diameter distributions of SHNPs prepared with different amounts of MPTMS (100, 150, 200 μL)
. TEM images of SHNPs prepared with different amounts of MPTMS
. (a) Standard curve of thiol groups with inset showing the reaction between Ellman’s agent and thiol groups, and (b) UV-Vis spectra of SHNPs mixed with Ellman’s agent
. TEM images of Ag@SHNPs
. SEM images (a, b) and energy-dispersive spectra (c, d) of Ag@SHNPs and Ag@SHNPs with 4-MBA
. (a) Hydrodynamic diameter distributions and (b) histogram of Zeta potentials of SHNPs, SHNPs with 4-MBA, Ag@SHNPs, Ag@SHNPs with 4-MBA, (c) FT-IR spectra of CMs, SHNPs, Ag@SHNPs, and (d) UV-Vis spectra of Ag@SHNPs, Ag@SHNPs with 4-MBA
. XRD pattern of Ag@SHNPs
. (a) Hydrodynamic diameters of CMs, SHNPs, and Ag@SHNPs in water against dilution, and (b) hydrodynamic diameters of Ag@SHNPs dispersed in RPMI 1640 medium and DMEM medium in 7 d
. CCK-8 cell viabilities of SMMC-7721, NIH-3T3, MEF, and HaCaT cells incubated with different Ag concentrations of (a) Ag@SHNPs and (b) Ag@SHNPs with 4-MBA for 24 h
. Raman spectra of Ag@SHNPs, Ag@SHNPs with 4-MBA and pure 4-MBA solution under 532 nm excitation
. Raman spectra of SMMC-7721 cells incubated with Ag@SHNPs with 4-MBA for 24 h


Set citation alerts for the article
Please enter your email address

© Copyright 2018-2021 | Chinese Laser Press. All Rights Reserved 沪ICP备15018463号-20