
Zhi-fen WANG, Wei-kuan JIA, Shan-hao MOU, Su-juan HOU, Xiang YIN, Ji ZE, [in Chinese]. KDC: A Green Apple Segmentation Method[J]. Spectroscopy and Spectral Analysis, 2021, 41(9): 2980
- Spectroscopy and Spectral Analysis
- Vol. 41, Issue 9, 2980 (2021)
Abstract
Introduction
Apple is the third largest fruit crop in the world, but it still adopts the production mode of artificial planting and artificial harvesting. It restricts the flow of labor and the development of the local economy. The solution to the problem is the development of apple's automatic harvesting robot[
In recent years, the segmentation of the uniform color fruit has also attracted the attention of many scholars. Li performed Gaussian linear fitting on the foreground image of the green apple under the V channel and used the threshold segmentation to cut the image[
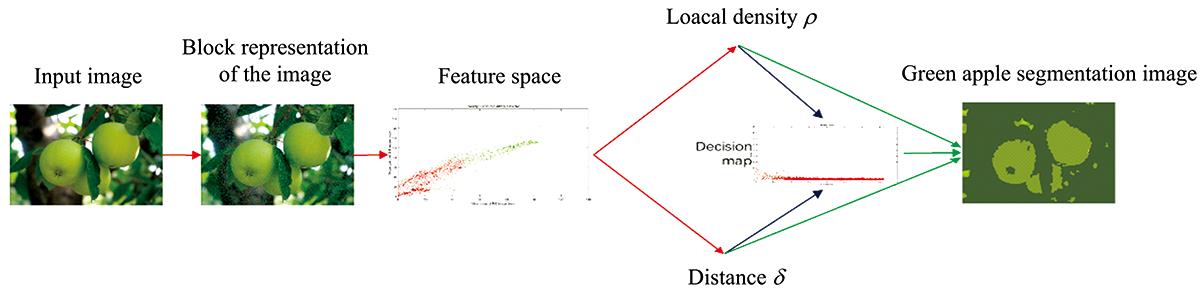
In view of the fact that the traditional algorithm is too stiff of the eigenvalue processing leads to an unsatisfactory accuracy rate. This paper proposes a green apple image segmentation algorithm based on density peak clustering. The local density and local difference of each data point are calculated. The decision map is kept separated from the cluster center and other data points. The double sorting algorithm automatically finds the cluster center to accomplish the clustering. The local density is calculated by kernel density estimation (KDE) without considering the manual setting of the cutoff distance, and the pixel level representation of the image is converted into a region level representation according to the SLIC algorithm, which greatly reduces the number of data points and reduces the analysis difficulty. The algorithm can process the boundary blur in the unsupervised and promote accuracy in segmentation results.
1 Image acquisition and method overview
1.1 Method overview
Accurate recognition of target boundaries in green apple image segmentation is still a problem. Boundary blurring creates great difficulty in segmentation problems caused by the approximate color of the apple target and the foliage in the background. This paper uses density peak clustering algorithm to segment green apple image and uses kernel density estimation and double sorting algorithm to optimize clustering algorithm effect.
In this paper, the SLIC superpixel algorithm[
![]()
Figure 1.Flow chart of improved density peak clustering green apple segmentation algorithm
1.2 Image acquisition
The image of the green apple was collected at the Longwangshan apple production base in Fushan District, Yantai City, Shandong Province. All images were collected under natural light conditions (including front lighting and backlight). The apple variety was fushi and gala. Image acquisition information: Canon SLR camera, the image format is jpg, the image acquisition resolution is 6 000×4 000. The image data collected in this paper is from orchard images during the day and night, including sunny and post-rain scenes.
![]()
Figure 2.Green apple image under various real conditions
2 Extract feature components
The basis of the density peak clustering algorithm is the distance between data points, and the distance is the description of the data points based on the feature components. The feature component represents the data point in a dimension of the feature space, which determines the distribution relationship of the data point. In this paper, the SLIC super-pixel algorithm is used to aggregate the approximate pixels to form irregular blocks, and the irregular blocks are used as image data points for cluster analysis. The color relationship between the foreground and the background is analyzed, the R-B image and the G-B image are constructed, and the average value of the pixel points in the irregular block is extracted as the feature component for calculation.
2.1 SLIC Superpixel Blocking
In order to reduce the high complexity of high-resolution images, the SLIC superpixel algorithm is used to aggregate similar pixels in a small area to form irregular blocks, and image blocks are used instead of pixels as a basic unit in cluster analysis. First, select the seed point evenly in the green apple image and set the seed point to 3 000. Calculate the relative distance from the non-seed point to the seed point, including the color information of the three channels and the two-axis information. According to the relative distance, the non-seed points perform k-means clustering, are assigned to the nearest seed point, and finally obtain the green apple image area represented by the irregular block. The image irregularity block maintains perceptual consistency with the pixel points of the original position. As shown in Figure 3, (a) is the real image input of the green apple, the image size is 6 000×4 000, and the image resolution is tens of millions. (b) There is a green apple image represented by an irregular block, each image irregularity block is a data point in cluster analysis, and a total of 3 172 image blocks. In the density peak cluster analysis, the number of data points has been reduced from tens of millions to thousands.
![]()
Figure 3.Green apple image and super pixel segmentation of green apple image
(a): Green apple image, size: 6 000×4 000;(b): Green apple image after super pixel segmentation, a total of 3172 super pixel regions
2.2 Feature components
Since the shape of the image block constructed by the SLIC algorithm is irregular, and the average number of pixels of the image block accounts for only 3/1 000 of the entire image, the consequence of the shape feature and the texture feature is reduced. Boundary blursing is caused by color approximation, which is manifested in the inaccuracy of the outline of the green apple, and a large number of areas are incorrectly segmented. Figure 4 is a binary image generated by pixel values 130 of three channels R, G, and B in a green apple image, with red lines being the target boundaries. The green apple and leaf areas are shown as approximations on the image, especially in Figure 4(c). The green apple target is completely included in the foreground of a G channel with a pixel value greater than 130, the green apple target is completely included. There is a lot of adhesion between the target boundary and the background, resulting in complex boundary blurring.
![]()
Figure 4.(a) Original image; (b) Area under the R channel with a pixel value greater than 130; (c) Area under the G channel with a pixel value greater than 130; (d) Area under the B channel with a pixel value greater than 130
The target areas in (b) and (c) of Figure 4 are full, and the foreground area overlaps with the real green apple target area by 70.98% and 84.40%. Figure (d) is not fully expressed, accounting for only 26.38%. For a background area with a pixel value greater than 130, Figure (c) contains more and Figure (d) has the least.The green apple target is the most abundant in the R channel and the G channel and is not obvious in the B channel. It is most difficult to distinguish the leaf background under the G channel. Under the B channel, the green background is not obvious and is not sensitive to green targets.
From figure 5, the histogram distribution of the target area and the background area of the green apple has a significant distribution difference in the R-B image and the G-B image. In order to reduce the noise and the number of data points, this paper obtains the district-level graph based on the SLIC algorithm, selects the regional mean of R-B image and G-B image as the feature component of the irregular block data point, and the functional space of the clustering segmentation problem of green apple image is constructed. The feature space is shown in figure 6, where the horizontal axis is the average of the R-B regions, and the vertical axis is the average of the G-B regions.
![]()
Figure 5.Numerical distribution of green apple target and background in R-B image and G-B image
![]()
Figure 6.The regional mean feature space of the green apple image area on the R-B image and the G-B image
Figure 6 is a feature space distribution of an irregular region of a green apple image based on an R-B image, and a G-B image region mean constructed herein. The blue diamond points are the first and second cluster centers of the cluster. The red data points are members of the first cluster class, the black pixel points are non-members of the second cluster class, and the green data points are members of the third cluster class. The shape of the edges between the clusters is irregular, and the low-density regions are the only intuitive features of the cluster-like boundaries.
3 KDE optimization density peak clustering segmentation algorithm
In the green apple image, the green apple target is similar to the background leaf color, and there is a boundary blur problem in the segmentation. Both are separated by low density regions only in the feature space, as shown in the Figure 6. Traditional clustering algorithms are difficult to deal with clustering problems with unclear boundaries.
The density peak clustering (DPC) algorithm can find high-density regions segmented by low-density regions and cluster clusters of arbitrary shapes. The cluster center of the density peak cluster is fixed, and the cluster category of other data points belongs to the closest local maximum density point. Breaking through the cluster shape must be a spherical limit. However, the density peak clustering algorithm must rely on manual operations, whether it is the setting of the cutoff distance or the choice of the cluster center. In this paper, kernel density estimation is used to analyze the local density, and the double sorting algorithm is used to automatically obtain the cluster center to get rid of the influence of manual setting parameters.
3.1 Principle of DPC
DPC assumes that the cluster center is surrounded by low density values and is farther away from higher density points. For each data point, two parameters are calculated: local density ρ and distance δ from the higher density point. The local density ρ is defined as
Where, if x(·)≤0, then X=1; if x(·)>0, then X=0. dij is the relative distance between data point i and data point j. dc is the cutoff distance and needs to be set manually. The local density ρi is equal to the number of data points closer to the data point i than the cutoff distance, and the distribution density of the data is described. The minimum of the distance between data point i and other higher local density data points is the distance δ
The distance δi is the minimum distance from the distance data point i in any other data point greater than the local density ρi. Note that the distance δi takes the maximum value in dij only when the local density ρi of the data point i is the maximum value. The density peak clustering algorithm can detect clusters of arbitrary shapes, and the clustering process does not require iteration and has a faster speed. But since the calculation of the parameters depends on the distance between the data points, when the data set is too large, the speed advantage disappears. The manually set cutoff distance affects the accuracy of clustering.
3.2 KDE optimization density peak cluster local density σ
The local density ρ represents the distribution of neighbor data points in the region with the cutoff distance as the radius in the feature space, reflecting the sparseness of the data distribution. The cutoff distance directly impacts the results, and the manually set defects are difficult to solve the boundary problem in the green apple segmentation. Kernel density estimation (KDE) can fully use the data itself to calculate, avoiding the influence of prior human knowledge, and at the same time can approximate the data to the greatest extent. This paper uses kernel density estimation to calculate the local density of data points
Where KW is the scaling kernel function, algorithm uses the Laplacian Kernel function
![]()
Figure 7.Local density distribution of data points
3.3 Distance from larger density points δi
The distance δi is a description of the degree of difference between the data points and the larger density points over their minimum distance. Calculated by the following formula
Where ρi is the local density of the data points calculated by the kernel density estimation method, and dij is the Euclidean distance of the irregular regions i and j in the feature space. The distance δi takes the maximum of the distances from any other regions only when the local density of the irregular regions is the largest. The distance δi of the remaining area is the minimum of the relative distances of other areas larger than the local density ρi.
3.4 Double sorting automatically finds the cluster center
Combining the local density ρi and the distance δi, the important characteristics of the cluster center are found. The cluster center is a data point having a large local density ρi and a distance δi. Thus, with the local density as the horizontal axis and the distance as the vertical axis, a decision map for finding the cluster center is constructed. As shown in Figure 8, the data points near the local density axis in the decision graph are cluster class members, and the distances are small and clustered. Anomalous points near the distance axis are clusters of individual points. The data points located in the upper right corner, called outliers, have a large local density and distance and are the cluster centers of the current data set. In recent years, the automatic selection of cluster centers has been achieved by determining the curve function or tree structure.
![]()
Figure 8.Decision diagram (the horizontal axis is the local density and the vertical axis is the distance)
![]()
Figure 9.The ratio of the number of cluster pixels to the total number of pixels (percentage)
The clustering decision of the non-clustered center data points is not completely dependent on the cluster center, that is, the number of cluster centers is not the final number of real clusters. At the same time, the complexity of the green apple image is mainly due to the complex relationship between the position and structure of the object in the image and the difficulty of recognition by the target green apple with the background near color. Image object categories can generally be divided into three categories, green apple target, background foliage, background sky soil and other elements.
The double sorting algorithm is used to select the cluster center automatically. According to the distance values, allirregular regions are arranged in descending order of local density values, and the first 20 are taken out in descending order. The first 15 data points that have been sorted twice are selected as the cluster center. Figure 9 shows the percentage of pixels included in the 15 clusters in the entire image. The first three clusters contain 98.88% of the total number of pixels. The ratio of the pixels of the remaining clusters in the population is less than 0.03% on average. The clustering error of the target area of the green apple is the judgment of the cluster class boundary, which is related to the first cluster class and the second cluster class. The algorithm results in this paper are shown in the figure 10.
![]()
Figure 10.Algorithm output imag
(a): Original green apple image; (b): Improved density peak clustering result map;(c): Improved density peak clustering segmentation map
4 Experiment
4.1 Experimental design
The collection of 86 green apple images contains various lighting conditions, complex occlusions and overlaps, sunny and post-rain conditions. In this paper, the efficiency of segmentation efficiency (SE), segmentation validity (SV), false positive rate (FPR) and false negative rate (FNR) are used as evaluation indicators to evaluate the effectiveness of the proposed method. In order to better verify the optimized density peak clustering image segmentation algorithm, this paper compares it with the method in the literature[
The operating environment of this research experiment: system environment Win 10, the calculation software is MATLAB2019a, the computer configuration is Inter® Core(TM) i7-6700 CPU @2.50GHz, RAM is 8.0GB.
4.2 Segmentation method verification
In this paper, the improved density peak green apple image segmentation algorithm processes the real-time captured image. For the real scene image including fruit overlap, leaf occlusion, post-rain scene, night environment and other conditions, select multiple segmentation effect maps for analysis. The split effect diagram is shown in Figure 11.
![]()
Figure 11.Segmentation effect diagram of the method
From the perspective of the segmentation effect, the proposed algorithm has excellent segmentation efficiency in various environments. If the leaf occlusion and the fruit overlap cause the boundary to be blurred, the target outline of the green apple in the segmentation map is clear, and the ambiguous division of the target edge and the background region does not substantially exist. The segmentation results were not affected by the irregular refraction caused by the rain on the green apples after the rain. The algorithm can work in a variety of weather conditions. For nighttime images, even night-time complex images with complex foliage obscuration and many targets in the scene, the target boundary of the green apple in the algorithm segmentation graph are still accurate and clear.
4.3 Results analysis and discussion
The algorithm and k-means, mean-shift, FCM and the search for image feature density peak are compared. The test results are shown in Figure 12. Our method can obtain the clear outline of the green apple for various environments and green apple image segmentation under various scenarios. From the perspective of the segmentation effect, the green apple target area has been clearly separated from the background, and compared with other algorithms, the proposed algorithm can distinguish the target area of the green apple from the background to the maximum extent, and the boundary contour is clear.
![]()
Figure 12.Results of five clustering segmentation image segmentation algorithms
From table 1, the average FNR of the optimized density peak cluster image segmentation algorithm is 15%, which is much lower than other clustering image segmentation algorithms. The average FPR of the proposed algorithm is only 2%, which is the lowest of the five algorithms. The segmentation efficiency and the effective segmentation type are another set of parameters for evaluating the segmentation algorithm, and the algorithm with the higher value has the best segmentation effect. The method of this paper is the highest value among the five clustering segmentation algorithms, whether it is segmentation efficiency or segmentation validity.
5 Conclusion
In order to explore the application of the visual core system of the green apple harvesting robot under unsupervised conditions, this paper studies the application of the unsupervised density peak clustering algorithm in green apple image segmentation. In the first step, the image of the green apple collected in the natural environment is converted into a regional image representation by the SLIC algorithm, and the region means value on the R-B channel and the G-B channel is extracted to construct the feature space. In the second step, two parameters of density peak clustering are calculated in the feature space. In this paper, the kernel density estimation is used instead of the local density calculation method, which relies on manually setting the cutoff distance, and the data points are recorded between the larger local density data points closest to the distance. The third step is to construct a decision graph and use the double sorting algorithm to select the cluster center. Finally, the non-clustered center data is allocated to the cluster class of the largest local density data point closest to the nearest one according to the order of local density. Complete the clustering.
The algorithm in this paper has ideal segmentation accuracy. The application of an unsupervised algorithm in the problem of green apple segmentation is realized. Compared with other clustering algorithms, the proposed algorithm improves the accuracy and greatly improves the fitting effect of the green apple target boundary.
References
[1] K Jia W, J Lian, Y Zhang et al. International Journal of Advanced Robotic Systems, 17, 25310(2020).
[2] S Amatya, A Gongal, M Karkee. Information Processing in Agriculture, 5, 498(2018).
[3] J Lv, Y Wang, L Xu et al. Scientia Horticulturae, 257, 108758(2019).
[4] Da-hua LI, Xiao YU, Hui ZHAO. Spectroscopy and Spectral Analysis, 39, 2974(2019).
[5] W Jia, R Luo, Y Tian et al. Computers and Electronics in Agriculture, 172, 105380(2020).
[6] V Alchanatis, M Bulanon D, F Burks T. Biosystems Engineering, 103, 12(2009).
[7] B Li, Y Long, H Song. International Journal of Agricultural and Biological Engineering, 11, 192(2018).
[8] C Barbosa J, W Maldonado Jr. Computers and Electronics in Agriculture, 127, 572(2016).
[9] Y Huang X, GL Li, C Ma et al. Transactions of the Chinese Society of Agricultural Engineering, 34, 142-148(2018).
[10] J He D, B Song H, D Wang D et al. Multimedia Tools and Applications, 78, 17391(2019).
[11] R Achanta, A Shaji, K Smith et al. IEEE Transactions on Pattern Analysis and Machine Intelligence, 34, 2274(2012).
[12] R Liu, H Wang, XM Yu. Information Sciences, 450, 200(2018).
[13] J Li, K Tian, J Zeng et al. Computers and Electronics in Agriculture, 165, 104962(2019).
[14] Y Akbulut, Y Guo, A Şengür et al. Measurement, 119, 28(2018).
[15] X Jia, T Lei, Y Zhang et al. IEEE Transactions on Fuzzy Systems, 27, 1753(2018).


Set citation alerts for the article
Please enter your email address

© Copyright 2018-2021 | Chinese Laser Press. All Rights Reserved 沪ICP备15018463号-20