State Key Laboratory of Precision Measurement Technology and Instruments, Department of Precision Instruments, Tsinghua University, Beijing 100084, China
Natural logarithm wavelength modulation spectroscopy (ln-WMS) is demonstrated in this Letter. Unlike the conventional wavelength modulation spectroscopy (WMS)-2f technique, it is a linear method even for large absorbance, which is the core advantage of ln-WMS. The treating method used in ln-WMS is to take the natural logarithm of the transmitted intensity. In order to determine the proper demodulation phase, the -seeking algorithm is introduced, which minimizes the absolute value of the first harmonic within the non-absorbing region. Subsequently, the second harmonic of the absorption signal is extracted by setting the demodulating phase as . To illustrate the validity of ln-WMS, it was applied to water vapor experimentally. The result shows that even if the absorbance (base-e) is between 1.60 and 6.26, the linearity between ln-WMS-2f and volume fraction is still established. For comparison, measurement with conventional WMS-2f was also done, whose response no longer kept linearity. The values retrieved in continuous measurements and the residuals were shown so as to evaluate the performance of the -seeking algorithm. Time consumed by this algorithm was roughly 0.28 s per measurement. As an alternative WMS strategy, ln-WMS has a wide range of potential applications, especially where the absorbance is large or varies over a wide area.
Spectrometry-based techniques have frequently been used for gas detection[1,2] because of the advantages of high sensitivity, rapid response, etc.[3], of which wavelength modulation spectroscopy (WMS) is one of the most popular and widely used for environmental monitoring[4], breath analysis[5,6], combustion diagnostics[7–10], and so on. WMS is well known as means to increase the signal-to-noise ratio. The emitted wavelength of the diode laser is modulated at the frequency of several kilohertz or megahertz, and the absorption parameters of the absorber can be acquired by analyzing the harmonics demodulated from the absorption signal. The conventional WMS-2f technique has to linearly calibrate the second harmonic to standard gases of known concentrations for recovering the absolute gas concentration[11–13]. However, this technique is only applicable to low absorbance (lower than 0.05 typically[14]), because the WMS-2f theory is based on the linear approximation of the Beer–Lambert law, and, if the absorbance is not small enough, the approximation will not be established any more nor will the linearity. In recent years, some “calibration-free” methods have been proposed to measure gas parameters, including not only concentration but also temperature and pressure. For instance, Rieker et al.[14] proposed the calibration-free method to measure the gas temperature and concentration in harsh environments by minimizing the difference between the experimental value and the simulated one. McGettrick et al.[15] proposed the phasor decomposition method, which is a calibration-free WMS technique and utilizes the residual amplitude modulation (RAM) signal of the first harmonic for measuring concentration and pressure simultaneously. Contrasting with the conventional WMS-2f method, calibration-free WMS does not necessarily require the absorbance to be low, while it is capable of multi-parameter measurement.
In this Letter, a new branch of WMS technique— natural logarithm wavelength modulation spectroscopy (ln-WMS)—is proposed. It can be regarded as an improvement of the conventional WMS-2f technique. The implementation of ln-WMS is kind of similar to conventional WMS-2f — they both require prior calibration, and their hardware configurations are nothing different. What is different is that ln-WMS does not place theoretical limits of absorbance, which is because no low-order approximation is made to the Beer–Lambert law in the deduction of ln-WMS. Just as its name implies, the natural logarithm of the transmitted intensity is taken in ln-WMS, so the term that includes absorption information will not exist on the exponent of e but will turn into a linear item instead; while in conventional WMS-2f theories, this is realized by substituting the Beer–Lambert law with its first-order approximation[12,13]. After confirming the demodulation phase with the -seeking algorithm, the central value of the second harmonic (ln-WMS-2f) is linear to the path-integrated concentration of the absorber, with no limitation on absorbance.
2. Theories of ln-WMS
It being a branch of WMS, the diode laser is modulated in the same way as any WMS technique, i.e., the laser frequency and intensity are synchronously modulated by a sinusoidal signal. The frequency modulation (FM) and amplitude modulation (AM) can be expressed as[14,16–18]where refers to the laser central frequency, is the FM depth, is the angular frequency of the modulation signal, is the average intensity, is the linear AM amplitude (normalized by ), is the phase of AM, and is the phase difference between FM and AM. When a beam of a laser passes through absorbing samples, the transmitted intensity is dominated by the Beer–Lambert law, where is the absorption coefficient at frequency ; and represent the volume fraction of the absorber and the optical path length laser that passes through the absorber, respectively. The term is called absorbance (base-e).
Sign up for Chinese Optics Letters TOC. Get the latest issue of Chinese Optics Letters delivered right to you!Sign up now
According to Eq. (3), the natural logarithm of can be expressed as follows:
In this way, the absorption term will become a linear term instead of an exponential term. According to the Taylor expansion of at , and the term can be rewritten as
The terms are polynomials of , and we do not care for the specific value of . The Fourier series of the time-dependent quantity can be expressed as where
We can learn from Eq. (15) that the second harmonic in ln-WMS is naturally free of laser intensity , so it can be potentially used for remote sensing without cooperative reflectors. and are related to inherent properties for a certain laser, so they are constant values at a constant modulation mode, and, when combined with Eq. (9), it is clear that is linear to with no limitation on absorbance.
Now we will discuss the -seeking algorithm. According to Eq. (12), the problem is equivalent to looking for so that . Noticing that it is a periodic function and its period is , we only have to seek the solution within the range of . Within one period, has only one maximum value and one minimum value, which are and zero, respectively, so we do not have to worry about falling into local minima. What we should do in the algorithm is to minimize by varying through iterations. More specifically, in each iteration, we should seek forward and backward starting from the initial value of with shrinking strides until is smaller than the preset threshold. The pseudocode is listed in Table 1.
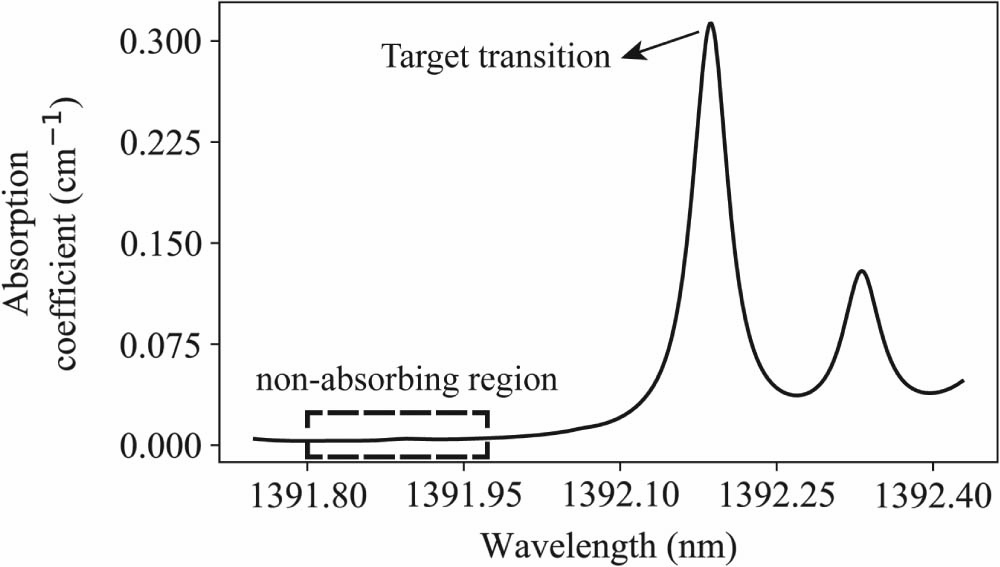
To confirm the availability of ln-WMS, we applied it to measuring water vapor. The principle of choosing the probe absorption line is that there have to be non-absorbing spectral regions nearby, so that can be obtained and can be retrieved. We chose the transition around 1392.2 nm as the probe. Figure 1 illustrates the absorption coefficient of water vapor around 1392.2 nm, from which we can see that there exists a spectral region where the absorption coefficient is approximately zero. It could be also known from Fig. 1 that there is slight spectral overlapping between the target transition and its adjacent absorption line, the main influence of which is to cause distortion to the side band of , as is illustrated in Fig. 2. The side band on the right of (sample points: 2000–3000) is not completely symmetrical with that on the left (sample points: 0–1000), where the former is distorted by the adjacent absorption line. The schematic of the experimental setup is illustrated in Fig. 3. In the experiment, a distributed feedback (DFB) diode laser (PL-DFB-1392-A-1-SA-14BF, LD-PD) emitting around 1392 nm was employed as the laser source. The laser beam was coupled into a multi-pass gas cell with an optical length of 8 m. The DFB laser was controlled by an integrated laser driver and temperature controller (LDTC 1020, Wavelength Electronics). The modulating signal composed of a 10 Hz saw tooth wave and a 5 kHz sine wave was generated by an NI-USB-6341 I/O device. The transmitted intensity was received by a photodiode detector (PDA20CS2, Thorlabs), whose output voltage was recorded by a data acquisition device (DAQ HATS 118, MCC) mounted on a Raspberry Pi 4B (CPU: Broadcom BCM2711B0 1.5 GHz, RAM: 4G). All of the computations including the demodulation processes and the -seeking algorithm are executed on Raspberry Pi, and the programming language we used was Python 3.7.
Figure 1.Absorption coefficient of water vapor around 1392 nm (P = 1 atm, T = 296 K) based on HITRAN[19]. The non-absorbing region is indicated by the dotted rectangle.
A saturated steam at 0°C, 7°C, 14°C, 19°C, and 23°C was generated by a portable dew point generator (LI-610, LI-COR) and filled into the gas cell. According to Goff–Gratch equation, the volume fractions of water vapor at these temperatures are 0.6025%, 0.9878%, 1.5761%, 2.1668%, and 2.7709%, and the corresponding absorbance at the central frequency [i.e., , where is the central frequency of the absorption line] is 1.60, 2.23, 3.56, 4.90, and 6.26, respectively, calculated based on Fig. 1. For each measurement, we first tried to retrieve with the -seeking algorithm based on the non-absorbing region of the detected signal, as is illustrated in Fig. 4.
After that, the second harmonic was demodulated at phase from the absorption signal, and the central values of were recorded. An illustration of the demodulated second harmonic is shown in Fig. 2. The measured central values of (ln-WMS-2f) at different volume fractions are plotted in Fig. 5, where the expression of the fitted line is , and the goodness of fit is . For comparison, the responses of WMS-2f are plotted in the same figure. It is absolutely clear that under such large absorbance ln-WMS-2f is still linear to , however, this is not applicable to WMS-2f. As the volume fraction increases, WMS-2f rises with a shrinking slope in the beginning and then converts into descending. There have not been studies on this kind of relationship as far as we know, maybe because such a non-monotonic response makes it pretty difficult to find a universal fitting function. It is a theoretical limitation for conventional WMS-2f to exhibit nonlinearity at large absorbance, which is because in the WMS-2f theory the linearity relies on the linear approximation of the Beer–Lambert Law [Eq. (3)], , which is not valid for large absorbance.
Figure 5.Response of ln-WMS-2f (black dots) and WMS-2f (red inverted triangles). The black line represents the linear fit of ln-WMS-2f versus volume fraction.
One of the keys to the implementation of ln-WMS is to determine the value of . The values of retrieved with the -seeking algorithm during 90 s of continuous measurement are plotted in Fig. 6(a), from which it can be learned that for each measurement the retrieved would be very different. From Fig. 6(b), we can learn that mostly distributes near and , roughly and . According to Eq. (13), there is a direct correlation between and the phase of AM . Unstable circuit response of the signal generator (NI-USB-6341) and the laser driver would lead to the instability of the modulation phase applied to the laser diode and then cause the fluctuation of . Similarly, the inherent oscillation characteristics of the circuits would result into some certain distribution of . Anyway, it is impossible to determine an accurate in advance at all; thereby, it is necessary to retrieve in real time during the measurements. In other words, the function of the -seeking algorithm is to account for the instability of , so that the second harmonic would be properly retrieved and could be expressed as Eq. (15) whatever is. Figure 6(c) shows the mean of for each measurement, namely, the residuals of the -seeking algorithm, with which the validity of the algorithm is well illustrated. It took approximately 0.28 s (920 iterations roughly) for the algorithm to find in each measurement.
Figure 6.(a) η retrieved with the η-seeking algorithm during 90 s of continuous measurement (0.1 s per measurement); (b) frequency distribution histogram of η; (c) mean of for each measurement. The integral time of each point is 0.1 s.
The last thing worth mentioning is that, in applications where there is serious spectral congestion and non-absorbing regions like what Fig. 1 plots cannot be found, the non-absorbing intensity can be obtained by splitting the laser into two beams and directly irradiating one of them onto the detector without passing through absorbers, at the cost of complicating the implementation of ln-WMS. Another potential solution to spectral overlapping is to operate at a reduced pressure, which will lead to a diminished width of the absorption spectrum.
5. Conclusion
In conclusion, this Letter demonstrates the novel ln-WMS technique, which can be regarded as an improvement of WMS-2f. It also needs linear calibration beforehand, but unlike the conventional WMS-2f method, it does not have the theoretical limitation of low absorbance. From the theory of ln-WMS, it can be confirmed that the linearity between ln-WMS-2f and the path-integrated concentration is established regardless of absorbance. To get the correct demodulating phase for the second harmonic, the -seeking algorithm is proposed, working on minimizing the absolute value of the first harmonic within the non-absorbing spectral region. Experiments on water vapor offered convincing evidence that ln-WMS is valid even at large absorbance. This technique itself does not place theoretical limits, and it is especially applicable to large absorbance, such as measuring water vapor in ambient air.
References
[1] C. Ruan, D. Kong, J. Dai, K. Chen, S. Guo, X. Wu. High-resolution frequency-domain spectroscopy for water vapor with coherent and continuous terahertz wave. Chin. Opt. Lett., 17, 073001(2019).