
Yuru Wang, Shizhu Tian. Analysis of Surface-Bonded Strain Transfer Using Optical Frequency Domain Reflectometry Bare Fiber[J]. Laser & Optoelectronics Progress, 2021, 58(19): 1906005
- Laser & Optoelectronics Progress
- Vol. 58, Issue 19, 1906005 (2021)
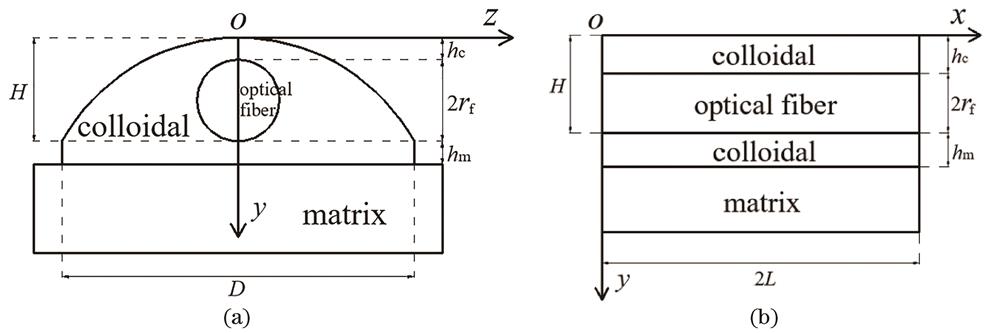
Fig. 1. Strain transfer analysis model. (a) Cross section; (b) longitudinal section
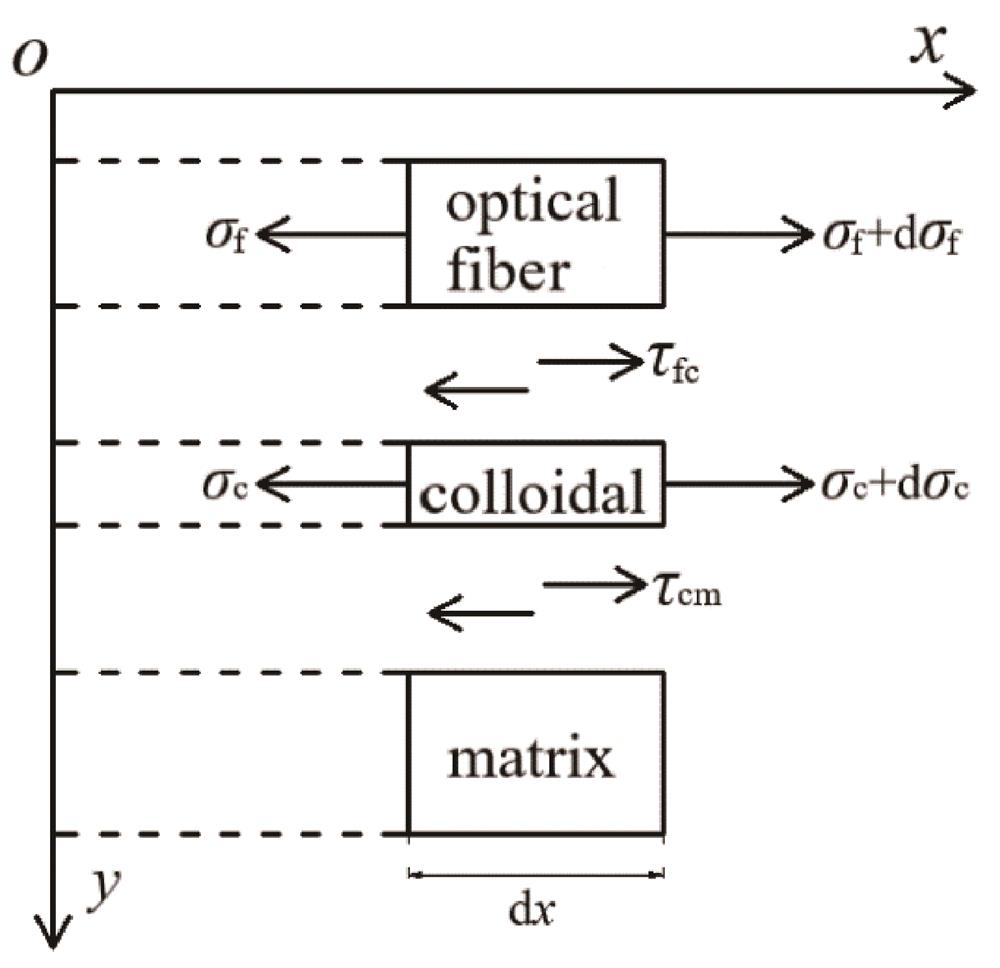
Fig. 2. Microelement force diagram of each layer
Fig. 3. Strain transfer rate curves of different colloidal shear modulus (2L=200 mm)
Fig. 4. Effect of strain transfer rate on length of paste section(2L=10,20,30,…,300 mm from center to the sides)
Fig. 5. Low strain transfer section varies with the paste length of fiber (hear modulus increases in turn in the direction of the arrow, L= 150 mm)
Fig. 6. High strain transfer section varies with the paste length of fiber (shear modulus increases in turn in the direction of the arrow, 2L= 300 mm)
Fig. 7. OSI-C distributed high precision frequency domain strain temperature analyzer
Fig. 8. Guhe FITEL-S1778 welding machine
Fig. 9. Fitting curve between theoretical strain and fiber average strain
Fig. 10. Equal strength beams bonded with different lengths of fiber
Fig. 11. Curves of strain transfer rate with different paste lengths. (a) Volume ratio of curing agent to binder is 1∶1; (b) volum ratio of curing agent to binder is 1∶2
Fig. 12. Changes of strain transfer rate with shear modulus of different adhesives prepared by curing agent and binder (volume ratio of 1∶1 and 1∶2). (a) Paste length 2L=200 mm; (b) paste length 2L=150 mm; (c) paste length 2L=100 mm; (d) paste length 2L=50 mm; (e) paste length 2L=30 mm
Fig. 13. Effect of different paste length and shear modulus of different adhesives prepared by curing agent and binder (volume ratio of 1∶1 and 1∶2) on high strain transfer section (2L=200 mm)
|
Table 1. Physical parameters of factors affecting strain transfer
|
Table 2. Main parameters of adhesive
|
Table 3. Comparative analysis of fiber strain and theoretical strain

Set citation alerts for the article
Please enter your email address
© Copyright 2018-2021 | Chinese Laser Press. All Rights Reserved 沪ICP备15018463号-20