
Raobo Li, Xiping Yuan, Shu Gan, Rui Bi. Point Cloud Simplification Optimization Strategy and Experimental Research Based on Multiple Algorithms[J]. Laser & Optoelectronics Progress, 2020, 57(23): 231402
- Laser & Optoelectronics Progress
- Vol. 57, Issue 23, 231402 (2020)
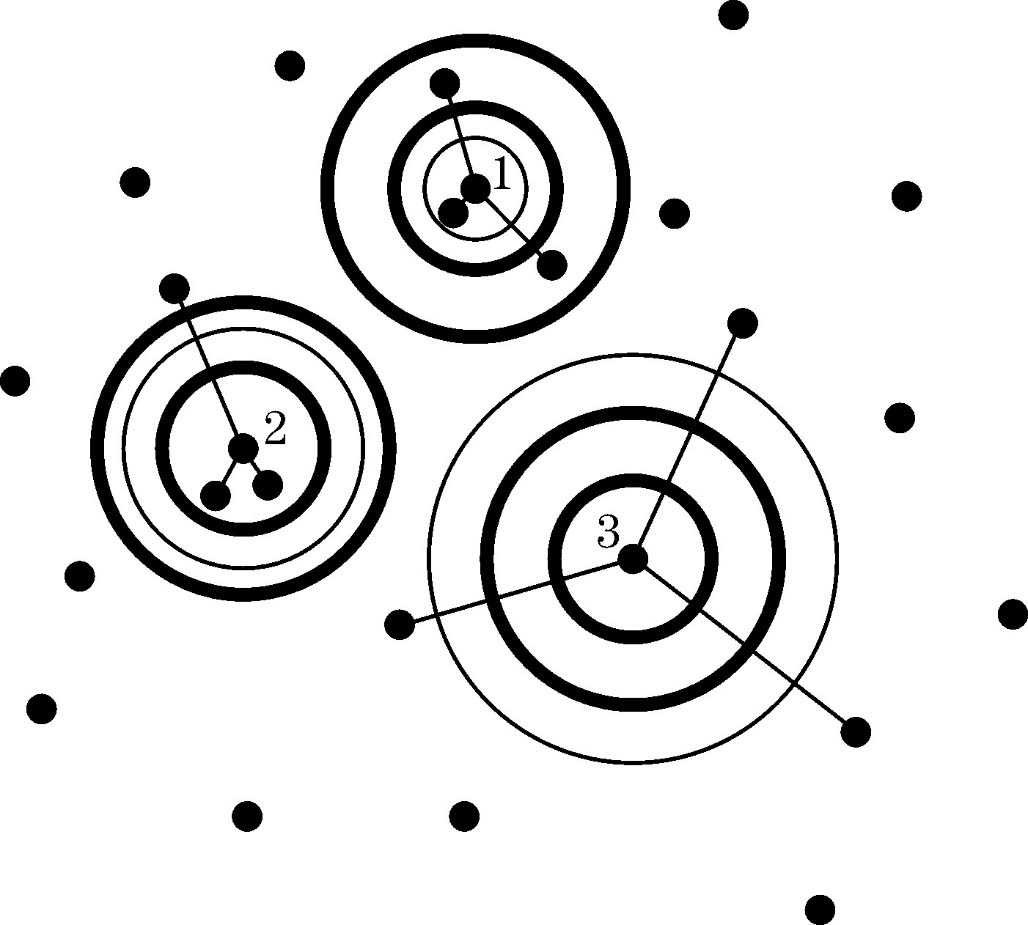
Fig. 1. Schematic of statistical filtering processing
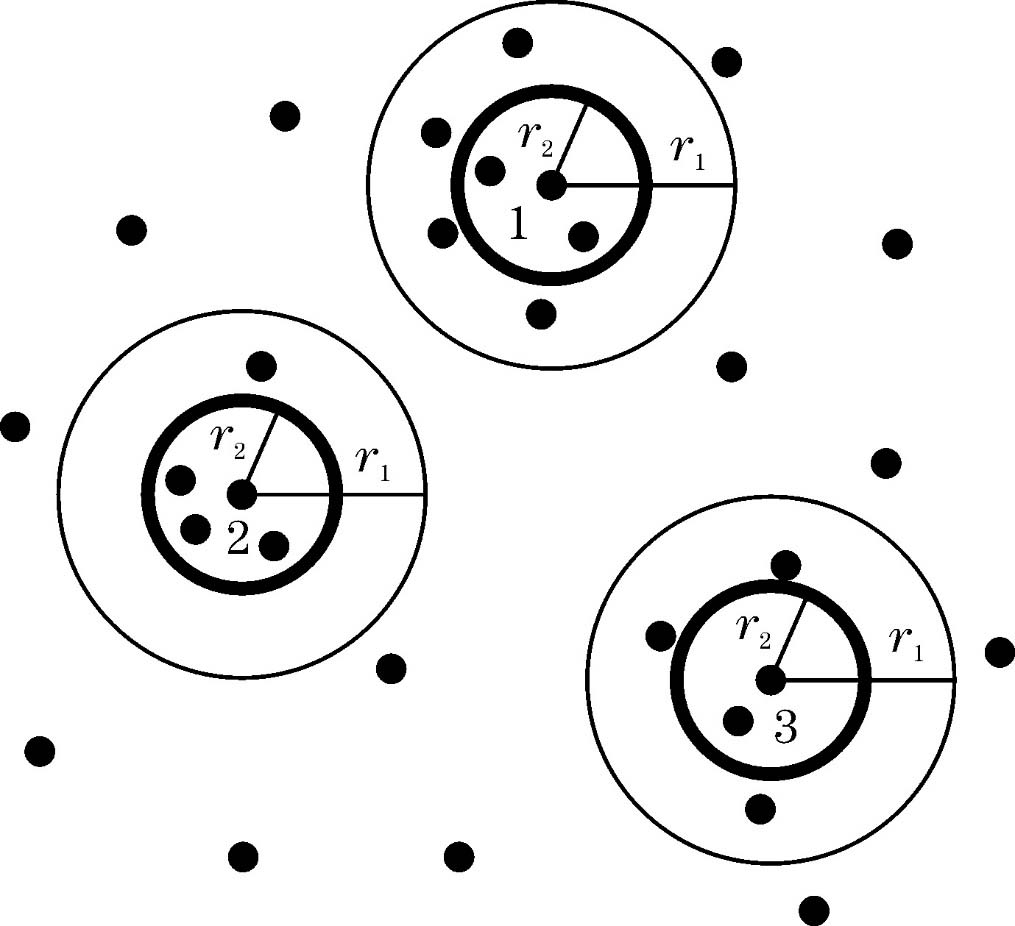
Fig. 2. Schematic of radius filtering processing
Fig. 3. Optimization strategy mainly deals with technical processes
Fig. 4. Results of three buildings point clouds using the proposed filtering optimization strategy(statistical filtering and passthrough filtering).(a1)(a2)(a3) Original point clouds of the three buildings;(b1)(b2)(b3)results of statistical filtering ;(c1)(c2)(c3) results of passthrough filtering
Fig. 5. Results of three buildings point clouds using the proposed filtering optimization strategy(CSF and radius filtering).(a1)(a2)(a3)Results of CSF ;(b1)(b2)(b3)local enlarged images of CSF;(c1)(c2)(c3)results of radius filtering ;(d1)(d2)(d3)local enlarged images of radius filtering
Fig. 6. Test results of 1 # building point cloud with three different compression methods.(a1)Point cloud after filtering;(a2)(a3)local enlarged images corresponding to box 1 and 2 in Fig. (a1) ;(b1)result of curvature graded compression;(b2)(b3)local enlarged images corresponding to box 1 and 2 in Fig. (b1);(c1)result are compressed by the Geomagic studio software;(c2)(c3)local enlarged images corresponding to box 1 and 2 in Fig. (c1);(d1)result of center point nearest point mesh compression;(d2)(d3)lo
Fig. 7. Test results of 2 # building point cloud with three different compression methods.(a1)Point cloud after filtering;(a2)(a3)local enlarged images corresponding to box 1 and 2 in Fig. (a1);(b1)result of curvature graded compression;(b2)(b3)local enlarged images corresponding to box 1 and 2 in Fig. (b1);(c1)result are compressed by the Geomagic studio software;(c2)(c3)local enlarged images corresponding to box 1 and 2 in Fig. (c1);(d1)result of center point nearest point mesh compression;(d2)(d3)loc
Fig. 8. Test results of 3 # building point cloud with three different compression methods.(a1)Point cloud after filtering;(a2)(a3)local enlarged images corresponding to box 1 and 2 in Fig. (a1);(b1)result of curvature graded compression;(b2)(b3)local enlarged images corresponding to box 1 and 2 in Fig. (b1);(c1)result are compressed by the Geomagic studio software;(c2)(c3)local enlarged images corresponding to box 1 and 2 in Fig. (c1);(d1)result of center point nearest point mesh compression;(d2)(d3)loc
|
Table 1. Changes in the number of point clouds in each program
|
Table 2. Comparison of entropy changes of different compression methods

Set citation alerts for the article
Please enter your email address
© Copyright 2018-2021 | Chinese Laser Press. All Rights Reserved 沪ICP备15018463号-20