
Daoxin Sun, Dongliang Zhang, Fu Bi, Lidan Lu, Zhehai Zhou, Lianqing Zhu. Application of Silicon-Based Microring Resonant Cavity in Integrated Optical Gyroscope Sensitive Unit[J]. Laser & Optoelectronics Progress, 2022, 59(13): 1313001
- Laser & Optoelectronics Progress
- Vol. 59, Issue 13, 1313001 (2022)
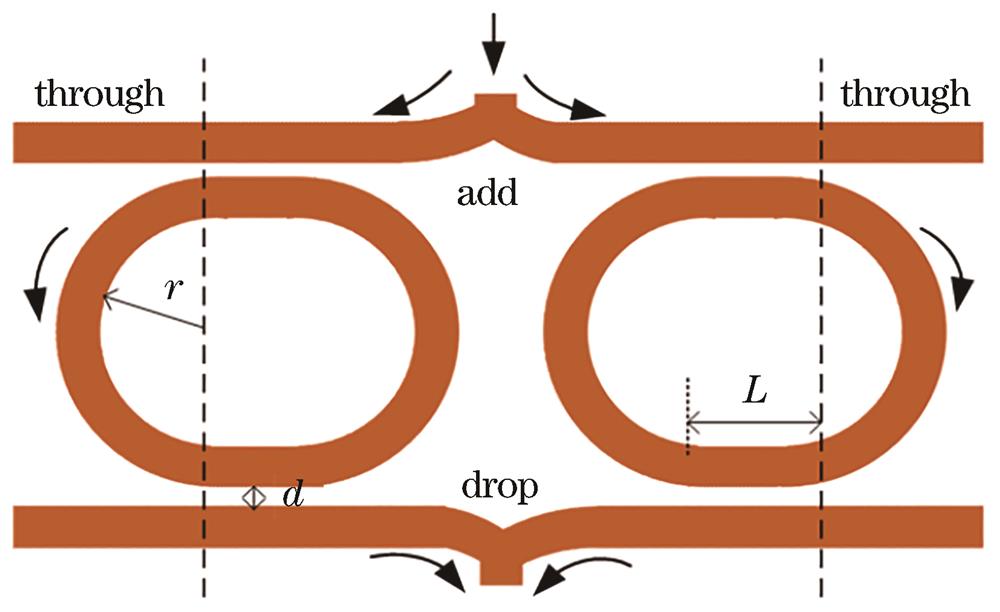
Fig. 1. Dual microring resonator structure based on SOI
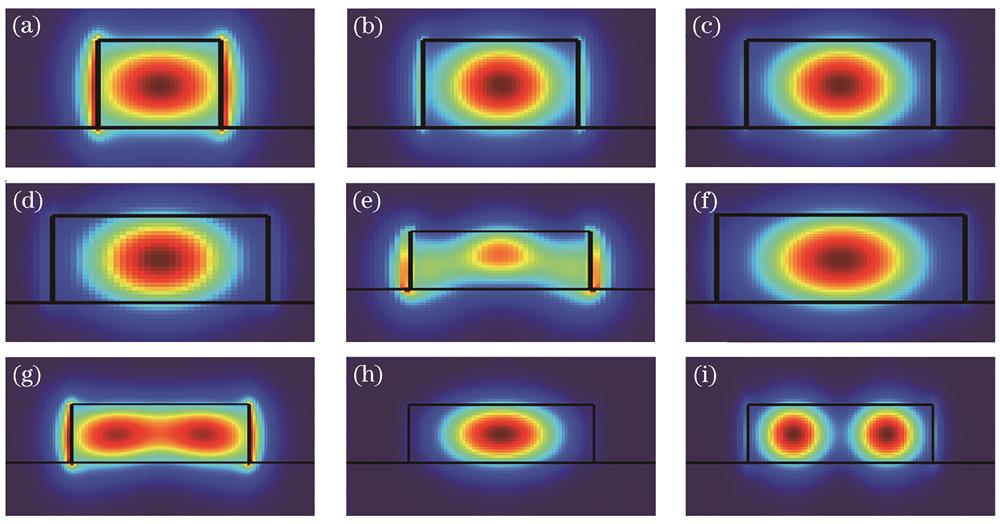
Fig. 2. Light field distribution of waveguides of different widths.(a) W=0.4
Fig. 3. Simulation diagram of the coupled structure
Fig. 4. Relationship between coupling coefficient, transmission coefficient and coupling length
Fig. 5. Simulation diagram of dual microring link
Fig. 6. Relationship between resonance spectrum andcoupling coefficient
Fig. 7. Relationship between quality factor and coupling coefficient under different transmission loss
Fig. 8. Spectral wavelength near 1550 nm
Fig. 9. Resonance curve of resonator with different transmission loss
Fig. 10. Picture of the dual microring resonator chip and layout of key devices
Fig. 11. Chip test module
Fig. 12. Schematic diagram of the waveguide coupling test platform
Fig. 13. Spectral ratio test fitting of the beam splitter
Fig. 14. Loss of the grating coupling structure
Fig. 15. Test spectrogram of dual microring resonator
|
Table 1. Structural parameters of the microring resonator
|
Table 2. Test results and simulation results

Set citation alerts for the article
Please enter your email address
© Copyright 2018-2021 | Chinese Laser Press. All Rights Reserved 沪ICP备15018463号-20