
Ting Qiao, Hansong Su, Gaohua Liu, Meng Wang. Object Detection Algorithm Based on Improved Feature Extraction Network[J]. Laser & Optoelectronics Progress, 2019, 56(23): 231008
- Laser & Optoelectronics Progress
- Vol. 56, Issue 23, 231008 (2019)
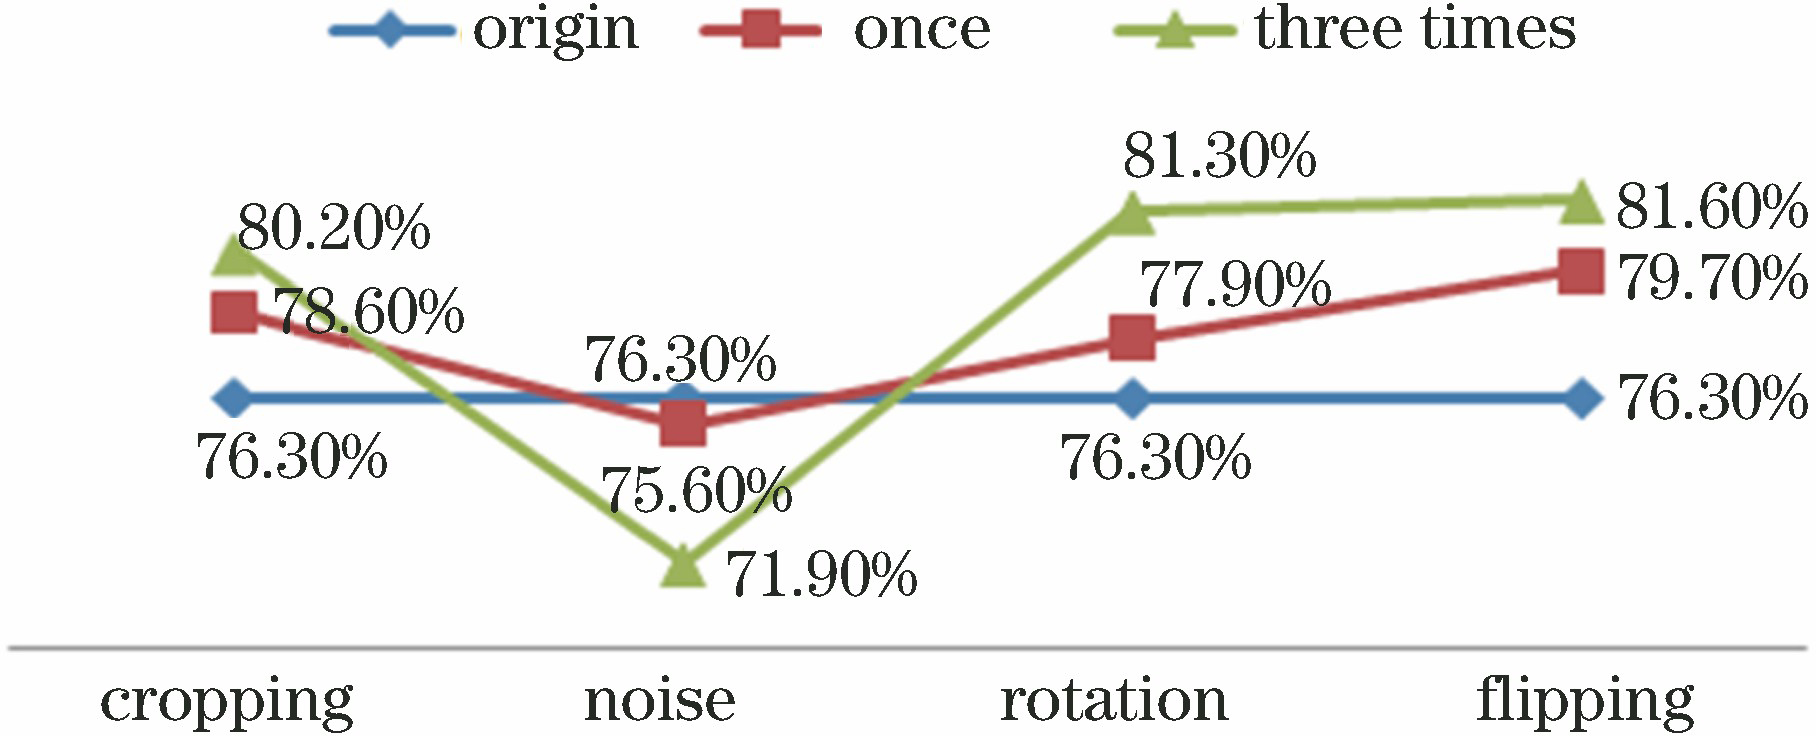
Fig. 1. Comparison of effects of four data augmentation techniques
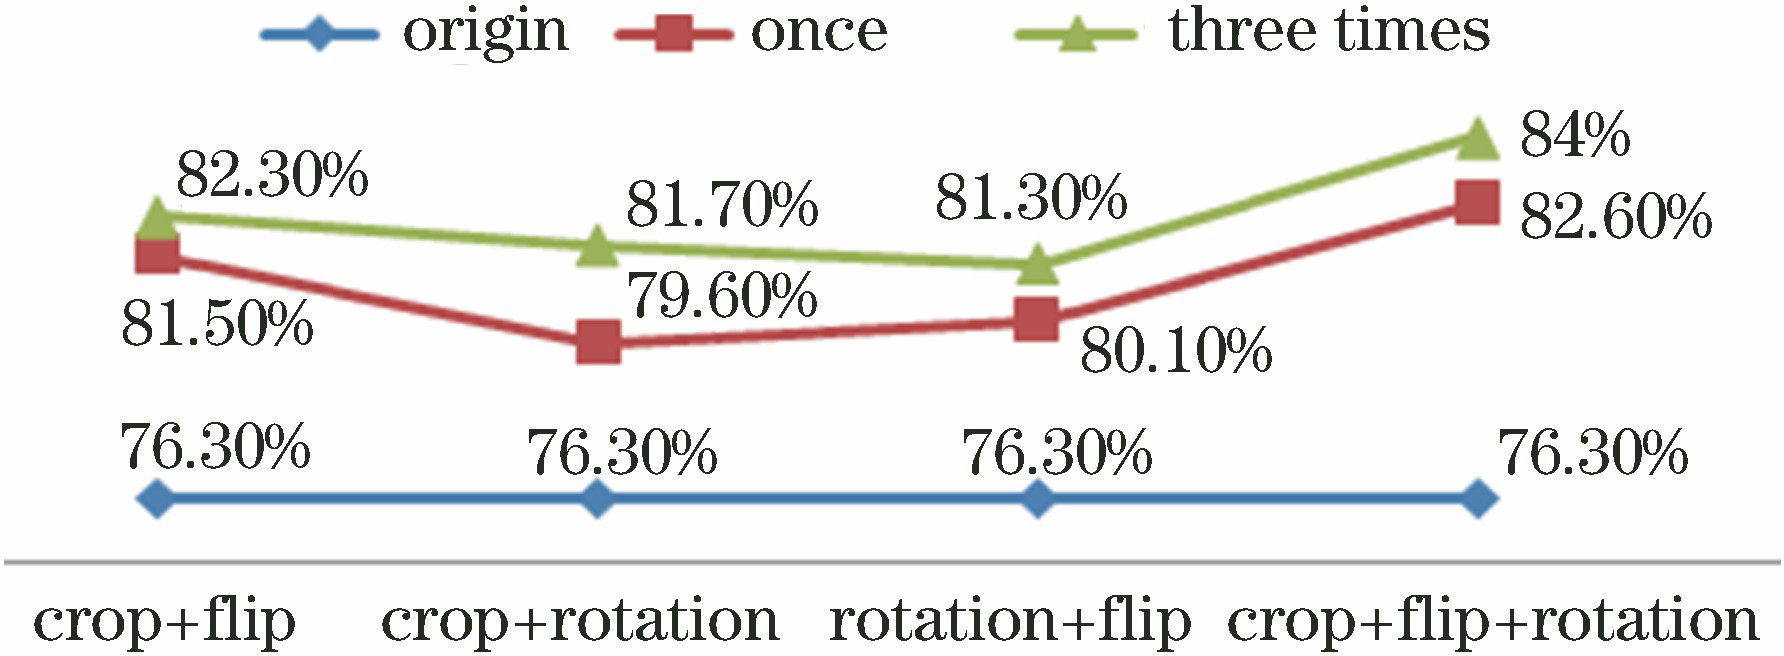
Fig. 2. Comparison of combination effects of flipping, cropping, and rotating methods
Fig. 3. Node representations of cell structures of ResNet, DensNet, and two-path networks. (a) ResNet network; (b) DensNet network; (c) two-path network
Fig. 4. Examples of traditional NMS problems. (a) Horses; (b) birds
Fig. 5. Trend of parameter quantity of feature extraction network with Top-1 error rate and 52, 100, and 133 layers
Fig. 6. Trend of parameter quantity of feature extraction network with Top-1 error rate and network growth rates of 12, 18, 24, and 48
|
Table 1. Structure of feature extraction network
|
Table 2. Comparison of complexity of different feature extraction networks
|
Table 3. Influences of IoU threshold, β parameter, and weighted average on AP (0.5, 0.6, and 0.7 represent different IoU thresholds; w represents weighted average)
|
Table 4. Influences of data augmentation and improved NMS mechanism on accuracy
|
Table 5. Influences of different epochs on accuracy
| |||||||||||||||||||||
Table 6. Testing results of different algorithms under VOC2007+VOC2012 training sets

Set citation alerts for the article
Please enter your email address
© Copyright 2018-2021 | Chinese Laser Press. All Rights Reserved 沪ICP备15018463号-20