• Chinese Journal of Lasers
  • Vol. 50, Issue 19, 1909001 (2023)
Wenjing Zhou1、3、*, Anqi Li1, Zhenkai Chen1, Guanghua Li2、3, Liang Qu2、3, and Yingjie Yu1、3
Author Affiliations
  • 1School of Mechatronic Engineering and Automation, Shanghai University, Shanghai 200444, China
  • 2The Palace Museum, Beijing 100009, China
  • 3China-Greece ‘Belt and Road’ Joint Laboratory on Cultural Heritage Conservation Technology, Beijing 100009, China
  • show less
    DOI: 10.3788/CJL230866 Cite this Article Set citation alerts
    Wenjing Zhou, Anqi Li, Zhenkai Chen, Guanghua Li, Liang Qu, Yingjie Yu. Defect Detection and Analysis in Murals Using Digital Holography[J]. Chinese Journal of Lasers, 2023, 50(19): 1909001 Copy Citation Text show less
    Schematic diagram of digital holographic diffuse imaging system
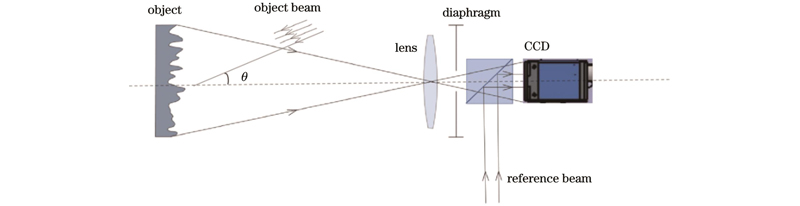
    Fig. 1. Schematic diagram of digital holographic diffuse imaging system
    Flow chart of digital holographic deformation detection
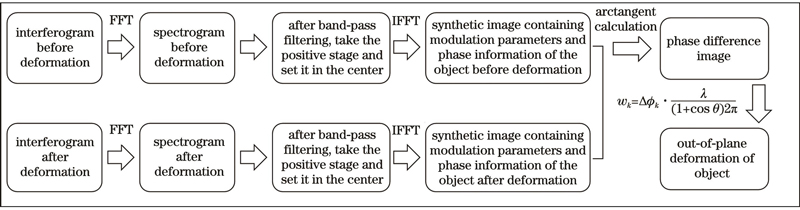
    Fig. 2. Flow chart of digital holographic deformation detection
    Digital holographic deformation detection system and experimental samples. (a) Photo of the experimental system; (b) aluminum plate sample; (c) spiral micrometer
    Fig. 3. Digital holographic deformation detection system and experimental samples. (a) Photo of the experimental system; (b) aluminum plate sample; (c) spiral micrometer
    Holograms collected before and after excitation and spectrum distribution. (a) Hologram collected before excitation; (b) hologram collected after excitation; (c) spectrum distribution of holograms
    Fig. 4. Holograms collected before and after excitation and spectrum distribution. (a) Hologram collected before excitation; (b) hologram collected after excitation; (c) spectrum distribution of holograms
    Deformation fringes and three-dimensional distribution of aluminum plate sample surface. (a) Deformation fringes produced by 5 μm displacement; (b) three-dimensional distribution of deformation fringes produced on force-excited aluminum plate surface by 5 μm displacement; (c) central cross-section diagram of three-dimensional deformation distribution shown in Fig. 5(b); (d) deformation fringes produced by 10 μm displacement; (e) three-dimensional distribution of deformation fringes produced on force-excited aluminum plate surface by 10 μm displacement; (f) central cross-section diagram of three-dimensional deformation distribution shown in Fig. 5(e)
    Fig. 5. Deformation fringes and three-dimensional distribution of aluminum plate sample surface. (a) Deformation fringes produced by 5 μm displacement; (b) three-dimensional distribution of deformation fringes produced on force-excited aluminum plate surface by 5 μm displacement; (c) central cross-section diagram of three-dimensional deformation distribution shown in Fig. 5(b); (d) deformation fringes produced by 10 μm displacement; (e) three-dimensional distribution of deformation fringes produced on force-excited aluminum plate surface by 10 μm displacement; (f) central cross-section diagram of three-dimensional deformation distribution shown in Fig. 5(e)
    Optical system and integration. (a) Photo of digital holographic deformation detection system; (b) interface of software about data collection and processing
    Fig. 6. Optical system and integration. (a) Photo of digital holographic deformation detection system; (b) interface of software about data collection and processing
    Schematic diagram of defects on wood-based mural sample. (a) Front side of the sample; (b) reverse side of the sample; (c) photo of mural sample defect detection
    Fig. 7. Schematic diagram of defects on wood-based mural sample. (a) Front side of the sample; (b) reverse side of the sample; (c) photo of mural sample defect detection
    A group of deformation fringes produced from defects on wood-based mural sample by acoustic scanning excitation
    Fig. 8. A group of deformation fringes produced from defects on wood-based mural sample by acoustic scanning excitation
    Deformation fringes produced from defects on wood-based mural sample by acoustic scanning excitation. (a) Deformation fringes produced from layer edges (acoustic excitation with 250 Hz); (b) deformation fringes produced from bonding parts (acoustic excitation with 224 Hz); (c) deformation fringes produced from back holes (acoustic excitation with 280 Hz)
    Fig. 9. Deformation fringes produced from defects on wood-based mural sample by acoustic scanning excitation. (a) Deformation fringes produced from layer edges (acoustic excitation with 250 Hz); (b) deformation fringes produced from bonding parts (acoustic excitation with 224 Hz); (c) deformation fringes produced from back holes (acoustic excitation with 280 Hz)
    Building walls defect detection. (a) Subsurface of building walls; (b) photo of building walls defect detection
    Fig. 10. Building walls defect detection. (a) Subsurface of building walls; (b) photo of building walls defect detection
    Subsurface defects on building walls. (a) Photo of subsurface crack defect; (b) schematic diagram of subsurface crack defect cross-section; (c) photo of subsurface void defect; (d) schematic diagram of subsurface void defect cross-section
    Fig. 11. Subsurface defects on building walls. (a) Photo of subsurface crack defect; (b) schematic diagram of subsurface crack defect cross-section; (c) photo of subsurface void defect; (d) schematic diagram of subsurface void defect cross-section
    A group of deformation fringes produced from subsurface cracks by acoustic scanning excitation
    Fig. 12. A group of deformation fringes produced from subsurface cracks by acoustic scanning excitation
    Deformation fringes produced from subsurface defects by acoustic excitation. (a) Deformation fringes produced from subsurface crack (acoustic excitation with 224 Hz); (b) deformation fringes produced from subsurface void (acoustic excitation with 620 Hz)
    Fig. 13. Deformation fringes produced from subsurface defects by acoustic excitation. (a) Deformation fringes produced from subsurface crack (acoustic excitation with 224 Hz); (b) deformation fringes produced from subsurface void (acoustic excitation with 620 Hz)
    Photo of in-situ detecting of the mural and the detected zones. (a) Photo of in-situ detecting; (b) detection zones on the south wall; (c) detection zones on the western wall
    Fig. 14. Photo of in-situ detecting of the mural and the detected zones. (a) Photo of in-situ detecting; (b) detection zones on the south wall; (c) detection zones on the western wall
    Schematic diagram of the structural section of the tested mural
    Fig. 15. Schematic diagram of the structural section of the tested mural
    In-situ detection results of micro-defects on the south wall. (a) Deformation fringes of sampling zones A‒F; (b) three-dimensional distributions of abnormal structures in sampling zones A‒F
    Fig. 16. In-situ detection results of micro-defects on the south wall. (a) Deformation fringes of sampling zones A‒F; (b) three-dimensional distributions of abnormal structures in sampling zones A‒F
    In-situ detection results of micro-defects on the western wall. (a) Deformation fringes of sampling zones A‒F; (b) three-dimensional distributions of abnormal structures in sampling zones A‒F
    Fig. 17. In-situ detection results of micro-defects on the western wall. (a) Deformation fringes of sampling zones A‒F; (b) three-dimensional distributions of abnormal structures in sampling zones A‒F
    Wenjing Zhou, Anqi Li, Zhenkai Chen, Guanghua Li, Liang Qu, Yingjie Yu. Defect Detection and Analysis in Murals Using Digital Holography[J]. Chinese Journal of Lasers, 2023, 50(19): 1909001
    Download Citation