• Laser & Optoelectronics Progress
  • Vol. 59, Issue 13, 1329001 (2022)
Qun Xie1、2, Fugen Zhang3, and Lü Qieni1、2、*
Author Affiliations
  • 1School of Precision Instrument and Opto-Electronics Engineering, Tianjin University, Tianjin 300072, China
  • 2Key Laboratory of Opto-Electronics Information Technology of Ministry of Education, Tianjin 300072, China
  • 3Zhuhai Linkoptik Instruments Co., Ltd., Zhuhai 519085, Guangdong , China
  • show less
    DOI: 10.3788/LOP202259.1329001 Cite this Article Set citation alerts
    Qun Xie, Fugen Zhang, Lü Qieni. Ideal Laser Particle Size Analyzer and Its Lower Limit of Measurement and Resolving Power[J]. Laser & Optoelectronics Progress, 2022, 59(13): 1329001 Copy Citation Text show less
    Position of the photoelectric detection unit in the scattering light field
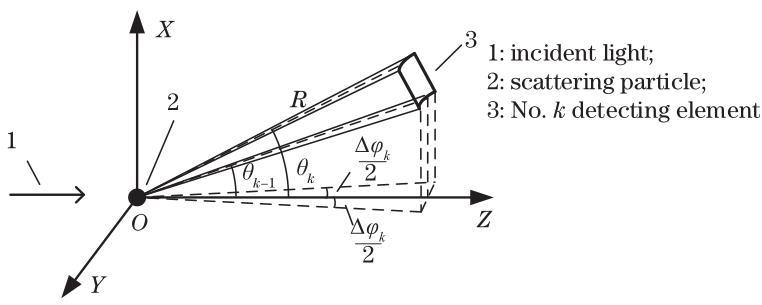
    Fig. 1. Position of the photoelectric detection unit in the scattering light field
    Signal distribution and power spectrum of scattering light. (a) Particles with a particle size of 1 μm; (b) particles with a particle size of 100 μm
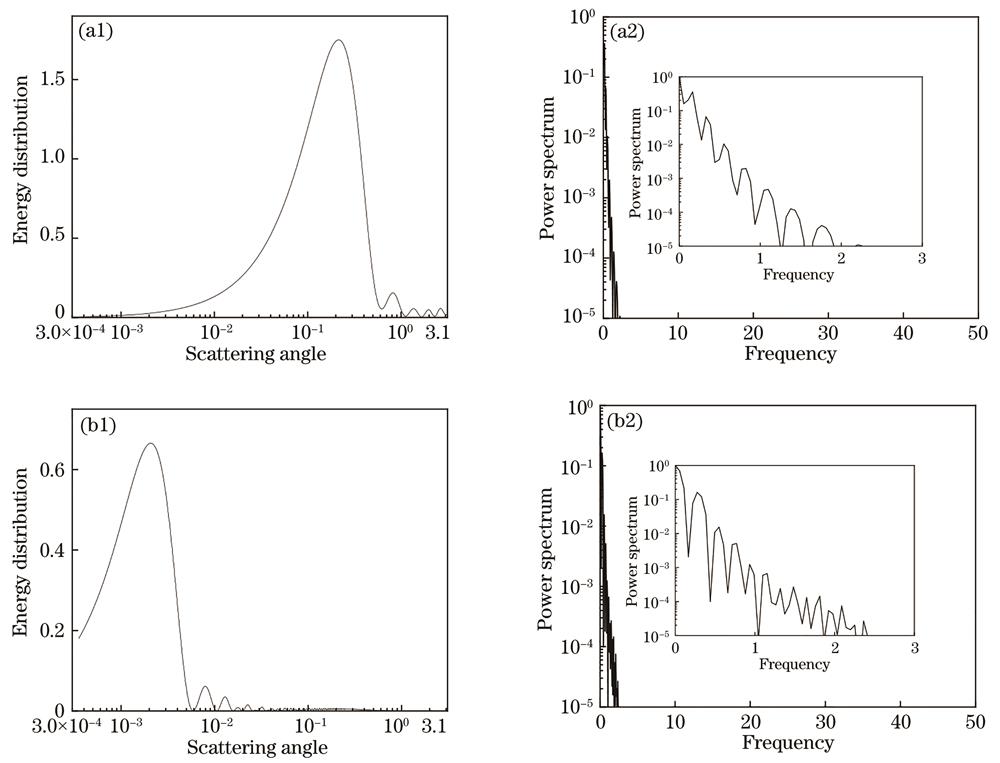
    Fig. 2. Signal distribution and power spectrum of scattering light. (a) Particles with a particle size of 1 μm; (b) particles with a particle size of 100 μm
    Fγ(D)curve of scattered light distribution of particles. (a) Single particle size; (b) average particle size segment
    Fig. 3. FγDcurve of scattered light distribution of particles. (a) Single particle size; (b) average particle size segment
    Lower limit of measurement for the ideal model. (a) Effect of noise on the lower limit of measurement; (b) effect of the refractive index of particles on the lower limit of measurement
    Fig. 4. Lower limit of measurement for the ideal model. (a) Effect of noise on the lower limit of measurement; (b) effect of the refractive index of particles on the lower limit of measurement
    Resolving power of ideal model under different noise. (a) mi =0; (b) mi =0.1
    Fig. 5. Resolving power of ideal model under different noise. (a) mi =0; (b) mi =0.1
    Effect of the real part of refractive index on resolving power (mi=0.1)
    Fig. 6. Effect of the real part of refractive index on resolving power (mi=0.1)
    Experimental device approximate to ideal laser particle size analyzer
    Fig. 7. Experimental device approximate to ideal laser particle size analyzer
    Particle size measurement results of single-dispersed standard samples. (a) 50 nm; (b) 100 nm; (c) 200 nm; (d) 300 nm
    Fig. 8. Particle size measurement results of single-dispersed standard samples. (a) 50 nm; (b) 100 nm; (c) 200 nm; (d) 300 nm
    Particle size measurement results for samples with bimodal distribution. (a) 50 nm and 200 nm; (b) 100 nm and 200 nm; (c) 200 nm and 300 nm; (d) 300 nm and 400 nm
    Fig. 9. Particle size measurement results for samples with bimodal distribution. (a) 50 nm and 200 nm; (b) 100 nm and 200 nm; (c) 200 nm and 300 nm; (d) 300 nm and 400 nm
    Sample size /nm50100200300
    Density coefficient1.09051.18921.09051.18921.09051.18921.09051.1892
    Median /nm51.8750.5599.2598.29199.67198.05301.22303.24
    51.2153.4298.5797.83198.93197.39299.49302.61
    53.2553.3899.3099.80199.24198.85301.30302.84
    Mean D50 /nm52.1152.4599.0498.64199.28198.10300.67302.90
    S /nm1.041.650.411.030.450.731.020.32
    Cv /%1.993.140.411.040.230.370.340.11
    Reference /nm51±3100±6203±5303±6
    Table 1. Particle size measurement results of single-dispersed standard samples
    Sample size /nm50100200300
    d1 /μm0.0510.1000.2030.303
    R /%22.450.567.375.0
    d2 /μm0.2030.2030.3030.401
    D2 /μm0.2230.1980.2970.400
    Table 2. Combination of the distinguishing test experiment mix
    Qun Xie, Fugen Zhang, Lü Qieni. Ideal Laser Particle Size Analyzer and Its Lower Limit of Measurement and Resolving Power[J]. Laser & Optoelectronics Progress, 2022, 59(13): 1329001
    Download Citation