• Geographical Research
  • Vol. 39, Issue 7, 1565 (2020)
Zhen LIU1、2, Wei QI1, Honggang QI1、2, and Shenghe LIU1、2、*
Author Affiliations
  • 1Key Laboratory of Regional Sustainable Development Modeling, Institute of Geographic Sciences and Natural Resources Research, CAS, Beijing 100101, China
  • 2University of Chinese Academy of Sciences, Beijing 100049, China
  • show less
    DOI: 10.11821/dlyj020190599 Cite this Article
    Zhen LIU, Wei QI, Honggang QI, Shenghe LIU. The evolution of regional population decline and its driving factors at the county level in China from 1990 to 2015[J]. Geographical Research, 2020, 39(7): 1565 Copy Citation Text show less
    The distribution of regional population decline units at the county level
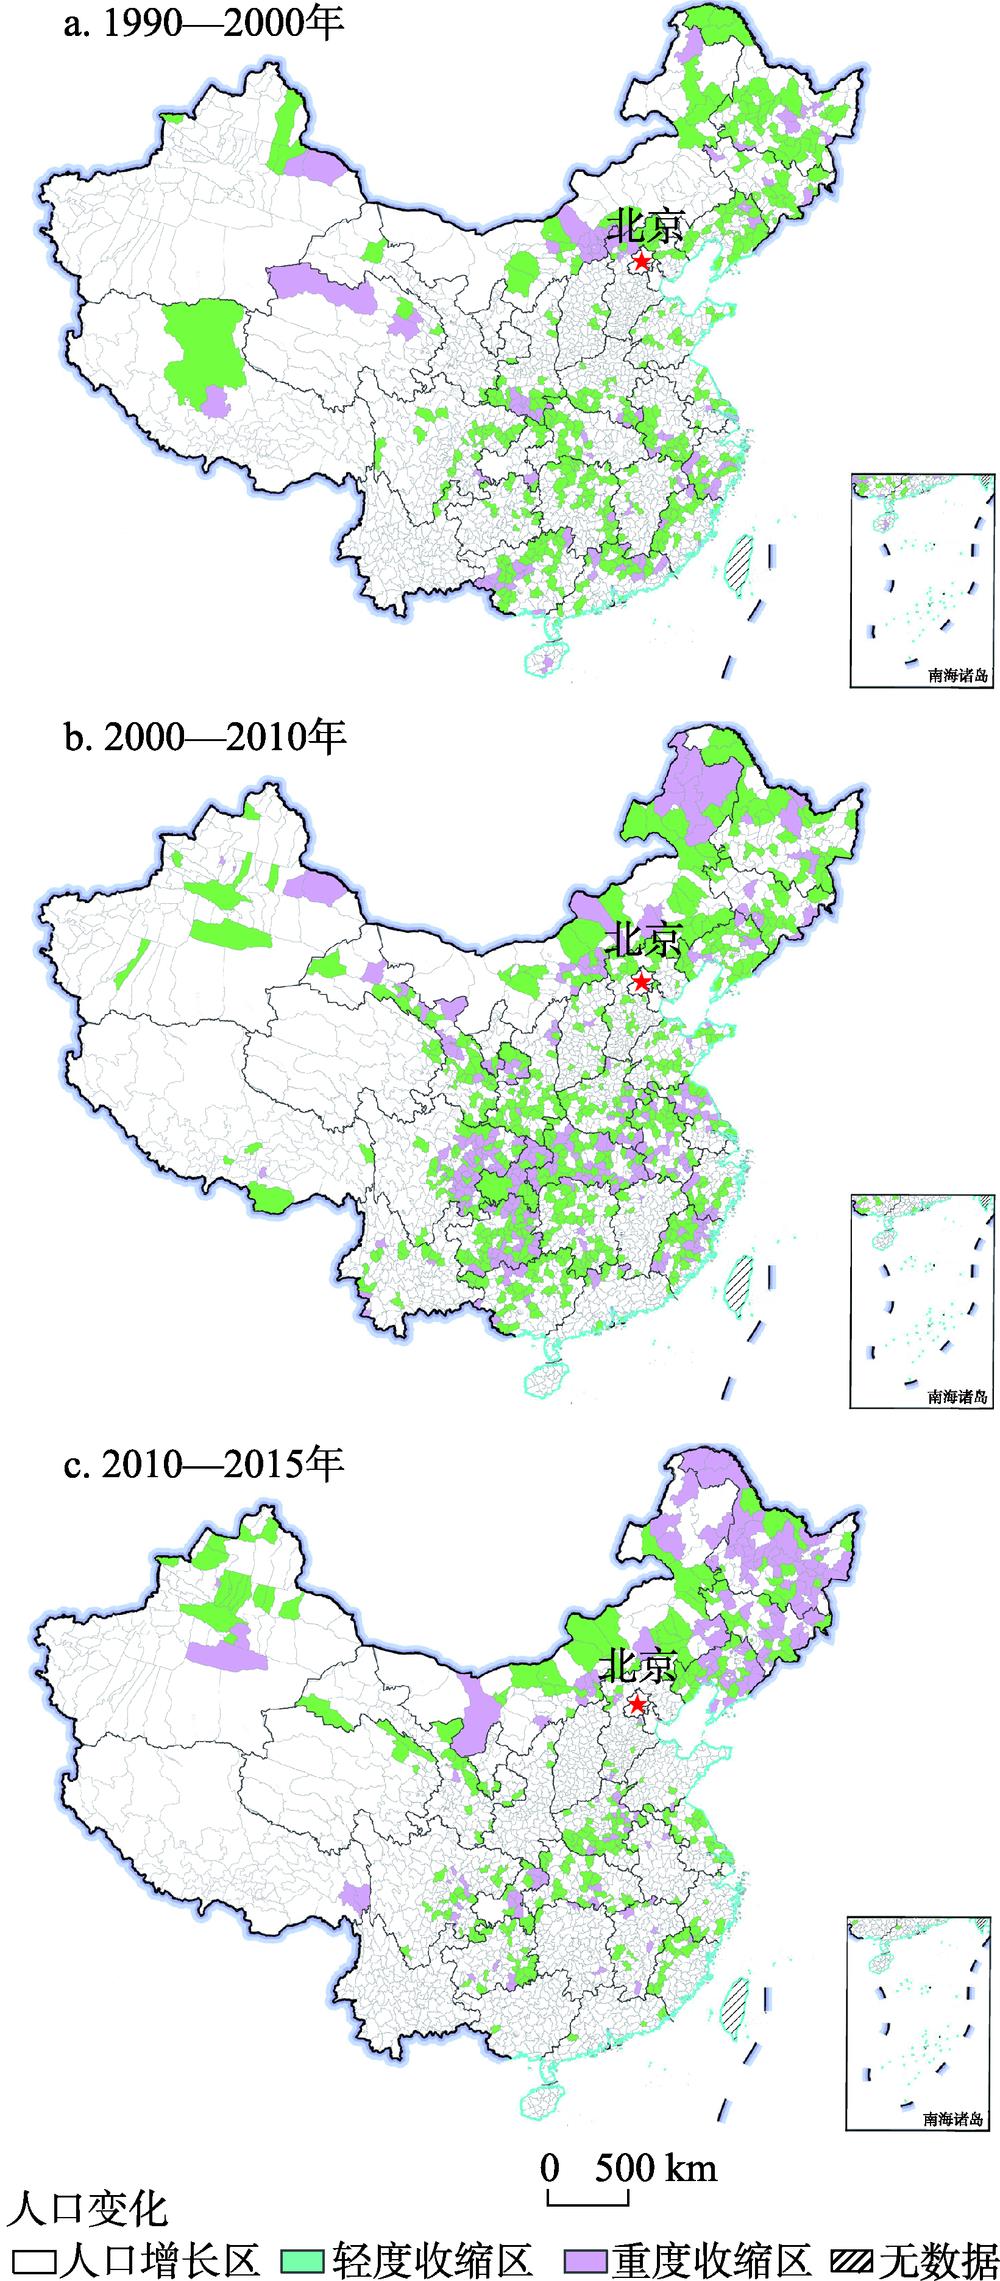
    Fig. 1. The distribution of regional population decline units at the county level
    The evolution of regional population decline at the county level
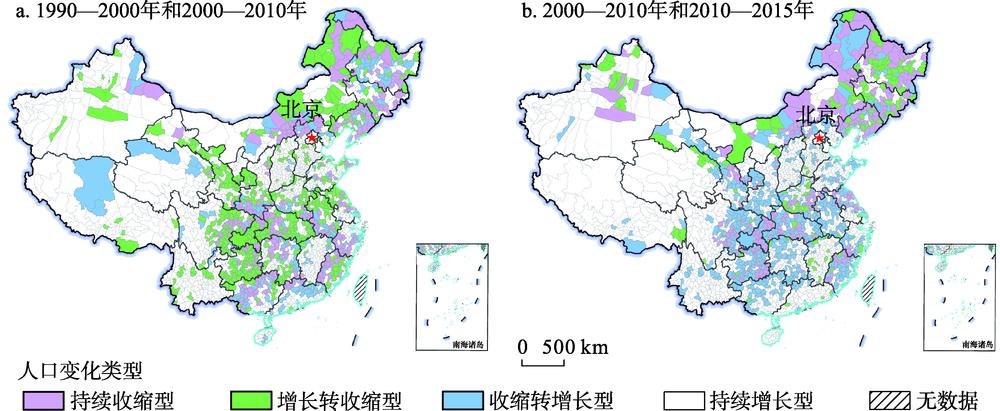
    Fig. 2. The evolution of regional population decline at the county level
    影响因素指标指标变量说明
    经济发展水平人均GDPPerGDP1990年为人均工农业生产总值,其他年份为人均国内生产总值
    非农就业占比Pjob二三产业从业人口占总人口的比例
    经济增长速度人均GDP增长率RGDP人均GDP期末值相比期初值的增长变化率
    非农就业占比变化Rjob非农就业占比期末值减去期初值
    公共服务和基础设施平均受教育年限Edu按照现行学制为受教育年数计算的6岁以上人口平均受教育年限
    交通便捷度Traffic根据区域内道路级别计算的栅格平均通行时间,其值越低则交通便捷度越高
    区位条件到最近大都市区的距离DisM研究单元与最近大都市区之间的直线距离
    到海岸线的距离DisC研究单元到海岸线的最短直线距离
    地形因素地形起伏度Terrain根据1 km×1 km DEM数据计算各区域的平均地形起伏度
    海拔高度Elevation根据1 km×1 km DEM数据计算各区域的平均海拔高度
    人口自然增长人口自然增长率Natural年自然增长人口与年平均人口的比值
    Table 1. The factors of regional population decline
    1990—2000年2000—2010年2010—2015年
    数量(个)占比(%)数量(个)占比(%)数量(个)占比(%)
    轻度收缩37617.755926.228413.4
    重度收缩1014.725712.11456.8
    小计47722.481638.342920.2
    Table 2. The number of population decline units at the county level in different periods
    东部地区占比中部地区占比西部地区占比东北地区占比
    1990—2000年2000—2010年2010—2015年1990—2000年2000—2010年2010—2015年1990—2000年2000—2010年2010—2015年1990—2000年2000—2010年2010—2015年
    轻度收缩19.522.812.617.928.416.113.125.013.036.241.355.5
    重度收缩6.28.20.22.210.81.34.213.51.14.612.413.3
    小计25.730.912.820.239.317.417.338.514.040.853.768.8
    Table 3. The percentage change of population decline units at the county level in four economic development zones (%)
    指标变量模型(1)模型(2)
    a 持续收缩型b 增长转收缩型c 收缩转增长型a 持续收缩型b 增长转收缩型c 收缩转增长型
    PerGDP-5.95***-1.81**-2.49**-1.15***-1.02***-0.30
    Pjob-1.61-4.97***-2.15-2.81*-6.18***-3.26*
    RGDP-0.810.96***4.26***-0.010.01-0.01
    Rjob-4.30**-8.86***-5.73***-4.32***-4.13***-1.88
    Edu3.812.124.65-5.41**-3.63**-2.47**
    Traffic3.35***2.25***4.22***4.32***1.54***4.00***
    Terrain-0.32***-0.25***-0.43***-0.37***-0.28***-0.42***
    Elevation-0.11**-0.08*-0.10-0.14**-0.13*-0.09
    DisM-1.11***-0.91***-1.04***-0.48-0.52***-0.42
    DisC-0.12*-0.15**-0.11-0.07*-0.10**-0.03
    Natural-0.17***0.01***-0.03**-0.46***-0.21***-0.25***
    C-9.90***-7.29***-16.30***-11.64***-2.01-13.17***
    Table 4. The results of the factors of regional population decline and its evolution between 1990-2000 and 2000-2010
    指标变量模型(3)模型(4)
    a 持续收缩型b 增长转收缩型c 收缩转增长型a 持续收缩型b 增长转收缩型c 收缩转增长型
    PerGDP-2.01***-0.33-0.67**-0.060.04-0.05
    Pjob-4.32***-1.72-5.09***-4.01***-2.11*-2.81***
    RGDP0.080.05-0.03-6.52***-3.41**3.42***
    Rjob-6.13***-2.99**-3.22***-4.59***-0.87**3.41***
    Edu-4.72*-5.61**-5.34***-3.82**-1.89**-3.10
    Traffic2.10***2.11***1.82***3.84***2.40***2.12***
    Terrain-0.41***-0.50**-0.19***-0.75***-0.69***-0.32***
    Elevation-0.21***-0.18**-0.06*-0.19***-0.16**-0.06**
    DisM0.010.11-0.81***0.130.32*-1.02***
    DisC-0.03**-0.07*-0.06**-0.06**-0.10*-0.12**
    Natural-0.30***-0.11***-0.21***-0.37***-0.21***-0.17***
    C-4.19***0.08**-3.63***-11.92***-8.45-6.86***
    Table 5. The results of the factors of regional population decline and its evolution between 2000-2010 and 2010-2015
    Zhen LIU, Wei QI, Honggang QI, Shenghe LIU. The evolution of regional population decline and its driving factors at the county level in China from 1990 to 2015[J]. Geographical Research, 2020, 39(7): 1565
    Download Citation