• Spectroscopy and Spectral Analysis
  • Vol. 40, Issue 11, 3549 (2020)
Cheng-ke WANG*, Ze-xiang ZHANG, Xiao-wei HUANG, Xiao-bo ZOU, Zhi-huang LI, and Ji-yong SHI
Author Affiliations
  • School of Food and Biological Engineering, School of Agricultural Equipment Engineering, Jiangsu University, Zhenjiang 212013, China
  • show less
    DOI: 10.3964/j.issn.1000-0593(2020)11-3549-07 Cite this Article
    Cheng-ke WANG, Ze-xiang ZHANG, Xiao-wei HUANG, Xiao-bo ZOU, Zhi-huang LI, Ji-yong SHI. Detection of Component Content Changes During Tofu Formation Based on Hyperspectral Imaging Technology[J]. Spectroscopy and Spectral Analysis, 2020, 40(11): 3549 Copy Citation Text show less
    Effect of material to liquid ratio on moisture and protein content of tofu (a), Effect of material to liqurd ratio on the texture properties of tofu (b)
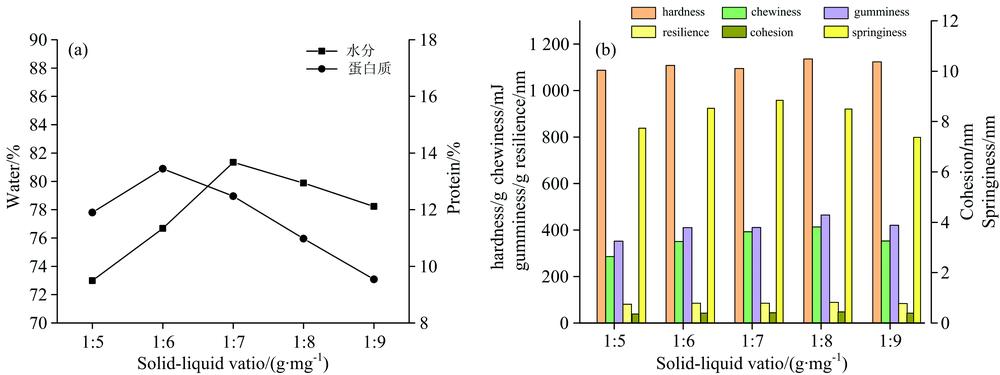
    Fig. 1. Effect of material to liquid ratio on moisture and protein content of tofu (a), Effect of material to liqurd ratio on the texture properties of tofu (b)
    Spectra of samples under different conditions(a): Soybean milk; (b): Hot soybean milk; (c): Gel; (d): Tofu
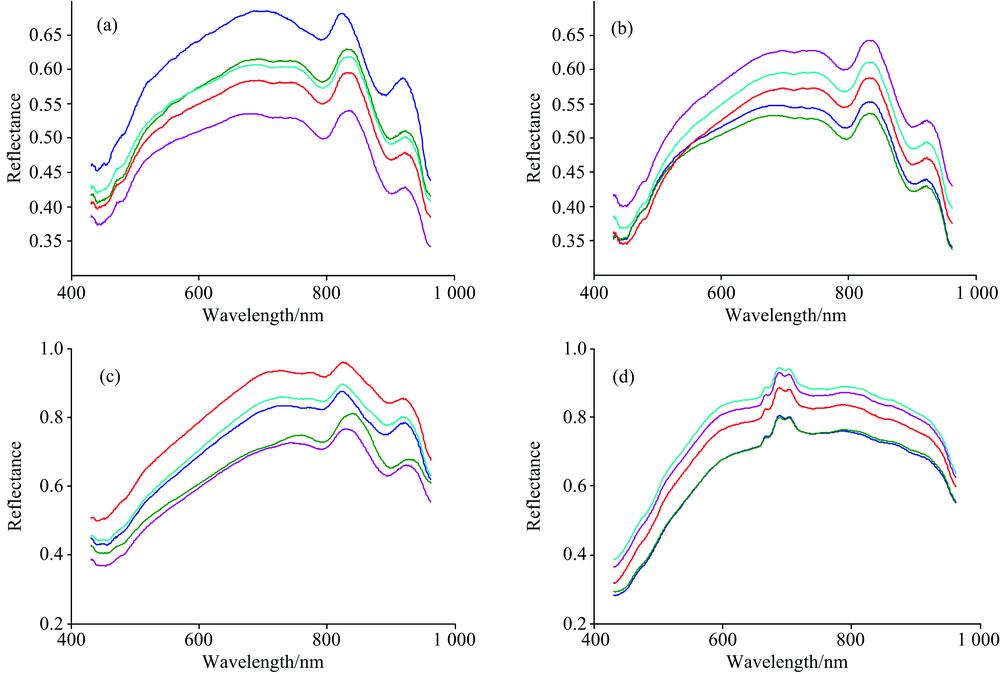
    Fig. 2. Spectra of samples under different conditions
    (a): Soybean milk; (b): Hot soybean milk; (c): Gel; (d): Tofu
    Characteristic wavelength ((a) soybean milk; (c) hot soybean milk; (e) gel; (g) tofu) and wavelength distribution ((b) soybean milk; (d) hot soybean milk; (f) gel; (h) tofu) selected by SPA method
    Fig. 3. Characteristic wavelength ((a) soybean milk; (c) hot soybean milk; (e) gel; (g) tofu) and wavelength distribution ((b) soybean milk; (d) hot soybean milk; (f) gel; (h) tofu) selected by SPA method
    Visualization images of water-content distribution (a) and protein content distribution (b)
    Fig. 4. Visualization images of water-content distribution (a) and protein content distribution (b)
    组分建模方法样品校正集交互验证预测集
    RCRMSECRMSECVRPRMSEP
    水分PCR豆浆0.843 80.419 50.433 10.852 20.422 2
    热浆0.834 40.594 70.623 60.849 70.619 5
    凝胶0.873 31.034 21.183 30.822 71.379 4
    豆腐0.744 21.469 81.703 30.634 71.864 6
    PLSR豆浆0.880 70.366 50.396 80.893 30.353 3
    热浆0.948 60.331 20.345 80.924 70.443 4
    凝胶0.923 40.803 90.883 40.928 60.838 7
    豆腐0.807 31.275 81.914 40.817 51.347 8
    蛋白质PCR豆浆0.790 80.215 00.220 20.795 50.213 8
    热浆0.872 60.167 80.170 40.904 50.154 0
    凝胶0.815 00.334 20.359 20.798 50.351 9
    豆腐0.705 90.727 70.861 60.609 10.838 2
    PLSR豆浆0.821 70.198 50.208 70.827 40.199 1
    热浆0.893 90.153 10.159 20.936 30.123 5
    凝胶0.958 40.158 40.169 80.953 90.173 0
    豆腐0.872 20.479 80.807 70.872 10.482 8
    Table 1. The prediction results of water and protein content by using PLSR and PCR models
    组分建模方法样品校正集交互验证预测集
    RCRMSECRMSECVRPRMSEP
    水分SPA+PLSR豆浆0.918 00.303 90.411 60.901 90.348 5
    热浆0.952 10.319 70.338 60.969 60.344 1
    凝胶0.947 40.666 20.724 00.951 50.760 6
    豆腐0.889 30.966 71.274 70.841 51.263 2
    蛋白质SPA+PLSR豆浆0.921 00.132 10.139 00.937 70.133 2
    热浆0.975 90.072 90.078 40.979 80.083 3
    凝胶0.963 40.148 70.205 50.977 80.134 7
    豆腐0.921 80.375 30.792 20.921 70.377 7
    Table 2. Prediction results of PLSR model using characteristic wavelengths
    Cheng-ke WANG, Ze-xiang ZHANG, Xiao-wei HUANG, Xiao-bo ZOU, Zhi-huang LI, Ji-yong SHI. Detection of Component Content Changes During Tofu Formation Based on Hyperspectral Imaging Technology[J]. Spectroscopy and Spectral Analysis, 2020, 40(11): 3549
    Download Citation