• Photonics Research
  • Vol. 1, Issue 1, 42 (2013)
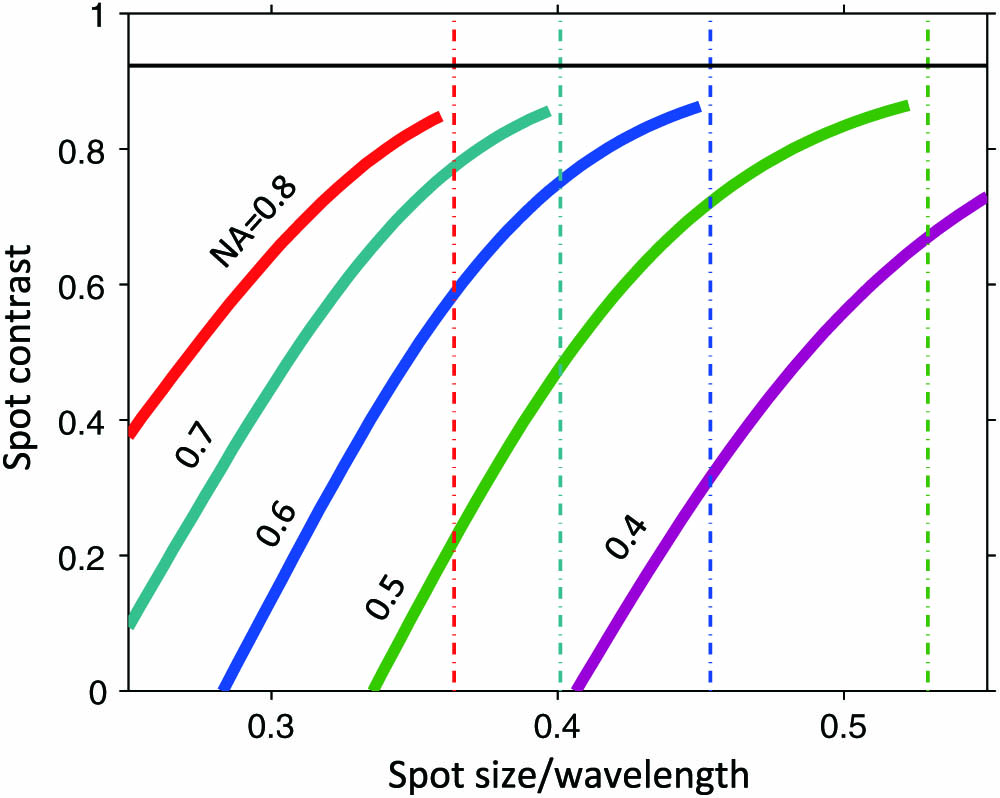
Xanthi Tsampoula1, Michael Mazilu1、*, Tom Vettenburg1, Frank Gunn-Moore2, and Kishan Dholakia1
Author Affiliations
  • 1SUPA, School of Physics and Astronomy, University of St. Andrews, St. Andrews KY16 9SS, UK
  • 2School of Biology, Medical and Biological Science Building, University of St. Andrews, St. Andrews, North Haugh, Fife KY16 9TF, UK
  • show less
    DOI: 10.1364/PRJ.1.000042 Cite this Article Set citation alerts
    Xanthi Tsampoula, Michael Mazilu, Tom Vettenburg, Frank Gunn-Moore, Kishan Dholakia. Enhanced cell transfection using subwavelength focused optical eigenmode beams [Invited][J]. Photonics Research, 2013, 1(1): 42 Copy Citation Text show less
    Contrast ratio (If−Is)/(If+Is) between the peak intensity of the focal spot If and the peak intensity of the sidebands Is for different NA. The spot size is measured using the second-order momentum in the ROI and compared to the Airy disc for each NA considered (dot–dashed lines). The horizontal line indicates the contrast ratio for the Airy disc.
    Fig. 1. Contrast ratio (IfIs)/(If+Is) between the peak intensity of the focal spot If and the peak intensity of the sidebands Is for different NA. The spot size is measured using the second-order momentum in the ROI and compared to the Airy disc for each NA considered (dot–dashed lines). The horizontal line indicates the contrast ratio for the Airy disc.
    Comparison of theoretical and experimental light field cross sections of the photoporation beam. (a) and (b) Show the theoretical irradiance profiles of the sample, while (c) and (d) show the corresponding experimental images of the beam reflection from the coverslip, respectively, for the diffraction-limited (a),(c) and OEi beams (b),(d). The horizontal scale bar indicates a length of 1 μm. A focal-plane cross section determined using an NSOM is plotted in (e), for the diffraction-limited (thick solid blue line) and OEi beams (thin dashed red line). The maximum intensities are normalized to facilitate comparison. Using Gaussian fitting, it can be seen that the OEi method enables a reduction of the full width at half-maximum of the spot from 755 to 532 nm.
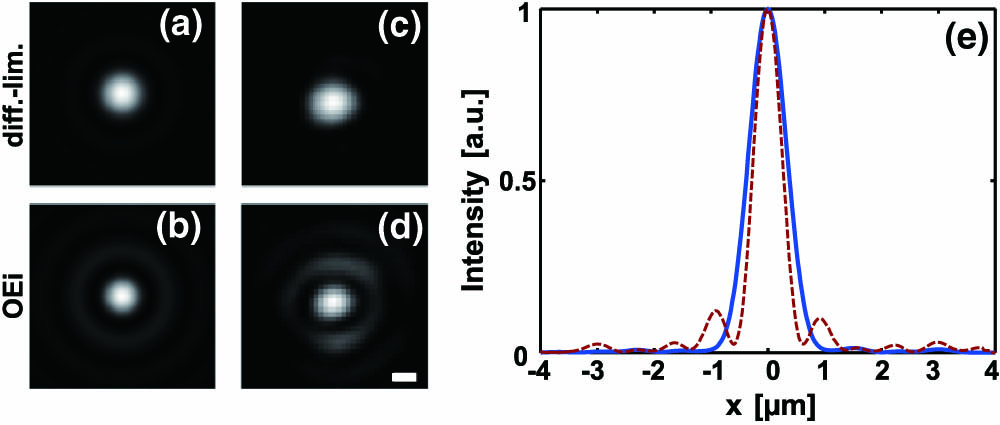
    Fig. 2. Comparison of theoretical and experimental light field cross sections of the photoporation beam. (a) and (b) Show the theoretical irradiance profiles of the sample, while (c) and (d) show the corresponding experimental images of the beam reflection from the coverslip, respectively, for the diffraction-limited (a),(c) and OEi beams (b),(d). The horizontal scale bar indicates a length of 1 μm. A focal-plane cross section determined using an NSOM is plotted in (e), for the diffraction-limited (thick solid blue line) and OEi beams (thin dashed red line). The maximum intensities are normalized to facilitate comparison. Using Gaussian fitting, it can be seen that the OEi method enables a reduction of the full width at half-maximum of the spot from 755 to 532 nm.
    Optical cell transfection apparatus. A laser beam is magnified and is incident on the microdisplay of the SLM. The SLM is subsequently relayed, through a demagnified telescope, at the back focal plane of the microscope objective, housed within a Nikon Eclipse Ti inverted optical microscope. HWP, half-wave plate; PBS, polarizing beam splitter; L, lens; M, mirror; MO, microscope objective; CCD, charge-coupled device camera.
    Fig. 3. Optical cell transfection apparatus. A laser beam is magnified and is incident on the microdisplay of the SLM. The SLM is subsequently relayed, through a demagnified telescope, at the back focal plane of the microscope objective, housed within a Nikon Eclipse Ti inverted optical microscope. HWP, half-wave plate; PBS, polarizing beam splitter; L, lens; M, mirror; MO, microscope objective; CCD, charge-coupled device camera.
    Transfection efficiency as a function of the beam focal area shown for the subdiffraction OEi beam, for the diffraction-limited beam (NA=0.54), and for various spot sizes corresponding to NAEFF=0.48, 0.44, and 0.37. Each data point reflects the average transfection efficiency obtained, corresponding to a total number of N=250 laser-treated cells for each focal area. A measure of the variability of the mean transfection efficiency, for five independently conducted trials, is represented by the vertical SE bars, whereas the statistical difference between the theoretical and experimentally estimated focal area values is indicated by the horizontal error bars.
    Fig. 4. Transfection efficiency as a function of the beam focal area shown for the subdiffraction OEi beam, for the diffraction-limited beam (NA=0.54), and for various spot sizes corresponding to NAEFF=0.48, 0.44, and 0.37. Each data point reflects the average transfection efficiency obtained, corresponding to a total number of N=250 laser-treated cells for each focal area. A measure of the variability of the mean transfection efficiency, for five independently conducted trials, is represented by the vertical SE bars, whereas the statistical difference between the theoretical and experimentally estimated focal area values is indicated by the horizontal error bars.
    Multiphoton comparison of the diffraction-limited beam and OEi beam: (a) two-photon, (b) three-photon, and (c) five-photon excitation. It can be noted that the sidelobes seen in Fig. 2(e) are suppressed, and that multiphoton OEi beams also reduce the focal spot size when compared to diffraction-limited multiphoton illumination.
    Fig. 5. Multiphoton comparison of the diffraction-limited beam and OEi beam: (a) two-photon, (b) three-photon, and (c) five-photon excitation. It can be noted that the sidelobes seen in Fig. 2(e) are suppressed, and that multiphoton OEi beams also reduce the focal spot size when compared to diffraction-limited multiphoton illumination.
    MethodFocal Spot (FWHM)
    Random diffuser [14]0.59λ/NA
    Airy disk0.51λ/NA
    Photoporation OEi beam0.36λ/NA
    Binary masks [15]0.34λ/NA
    OEi confocal imaging [16]0.31λ/NA
    OEi subdiffraction [11]0.26λ/NA
    Binary masks [5]0.26λ/NA
    OEi subwavelength [12]0.23λ/NA
    Table 1. Resolution Limit Relationship for Different Far-Field Subdiffraction Beamsa
    Xanthi Tsampoula, Michael Mazilu, Tom Vettenburg, Frank Gunn-Moore, Kishan Dholakia. Enhanced cell transfection using subwavelength focused optical eigenmode beams [Invited][J]. Photonics Research, 2013, 1(1): 42
    Download Citation